Faster troubleshooting. Better operational visibility. Built into your automation platform.
Modern network operations demand immediate visibility into system health and network connectivity to diagnose issues quickly and confidently.
Nautobot Professional extends the platform with built-in network utilities and troubleshooting capabilities. This enables engineers to investigate issues, from device-level checks to deep system diagnostics, directly within their Network Source of Truth, drastically reducing time to resolution and eliminating tool switching and context loss.
Network outages and operational issues rarely stem from a single source. Diagnosing problems often requires jumping between tools, manually gathering data, and piecing together context across systems.
Common challenges include:
Even in highly automated environments, troubleshooting often remains manual and reactive. Engineers lose valuable time switching between CLI sessions, monitoring tools, and application logs just to understand what’s happening.
Bottom line:
Without integrated troubleshooting and network utilities, even automated environments struggle to diagnose and resolve issues efficiently. This leads directly to increased Mean Time To Resolution (MTTR) and higher operational costs.
With integrated network tools and troubleshooting capabilities, teams move from reactive, fragmented workflows to streamlined, data-driven operations.
What improves:
Benefits:
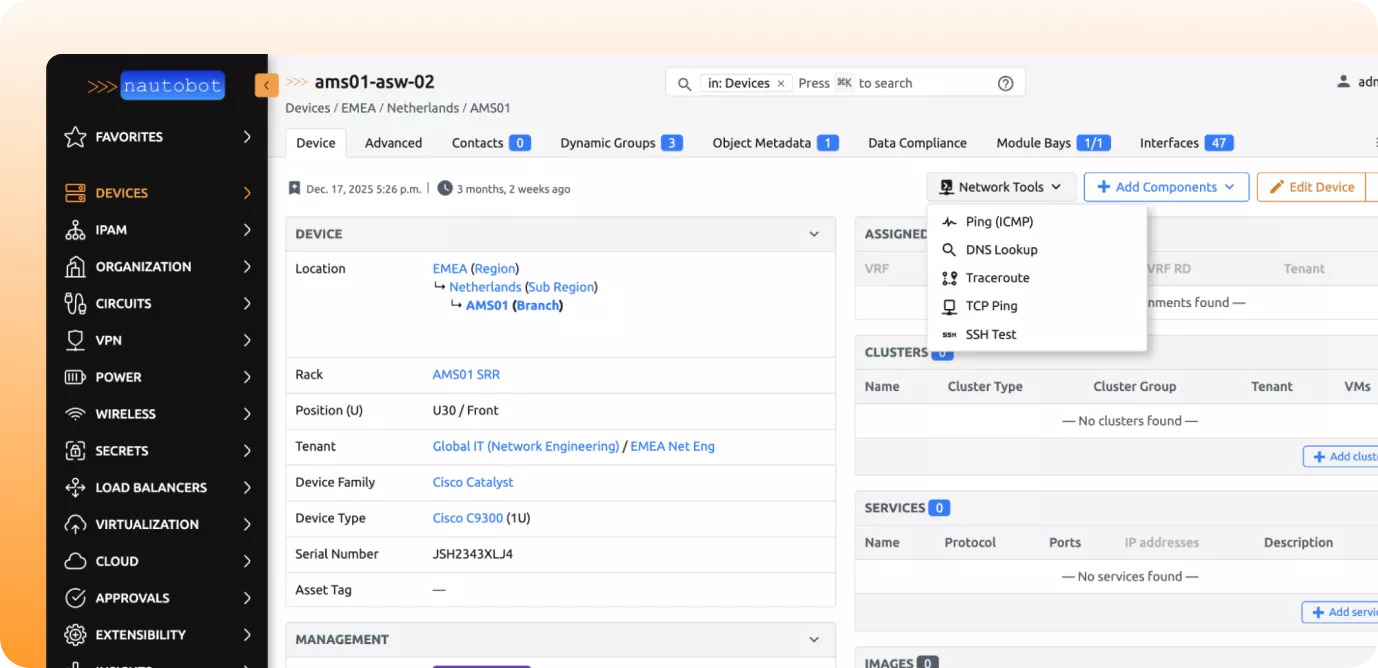
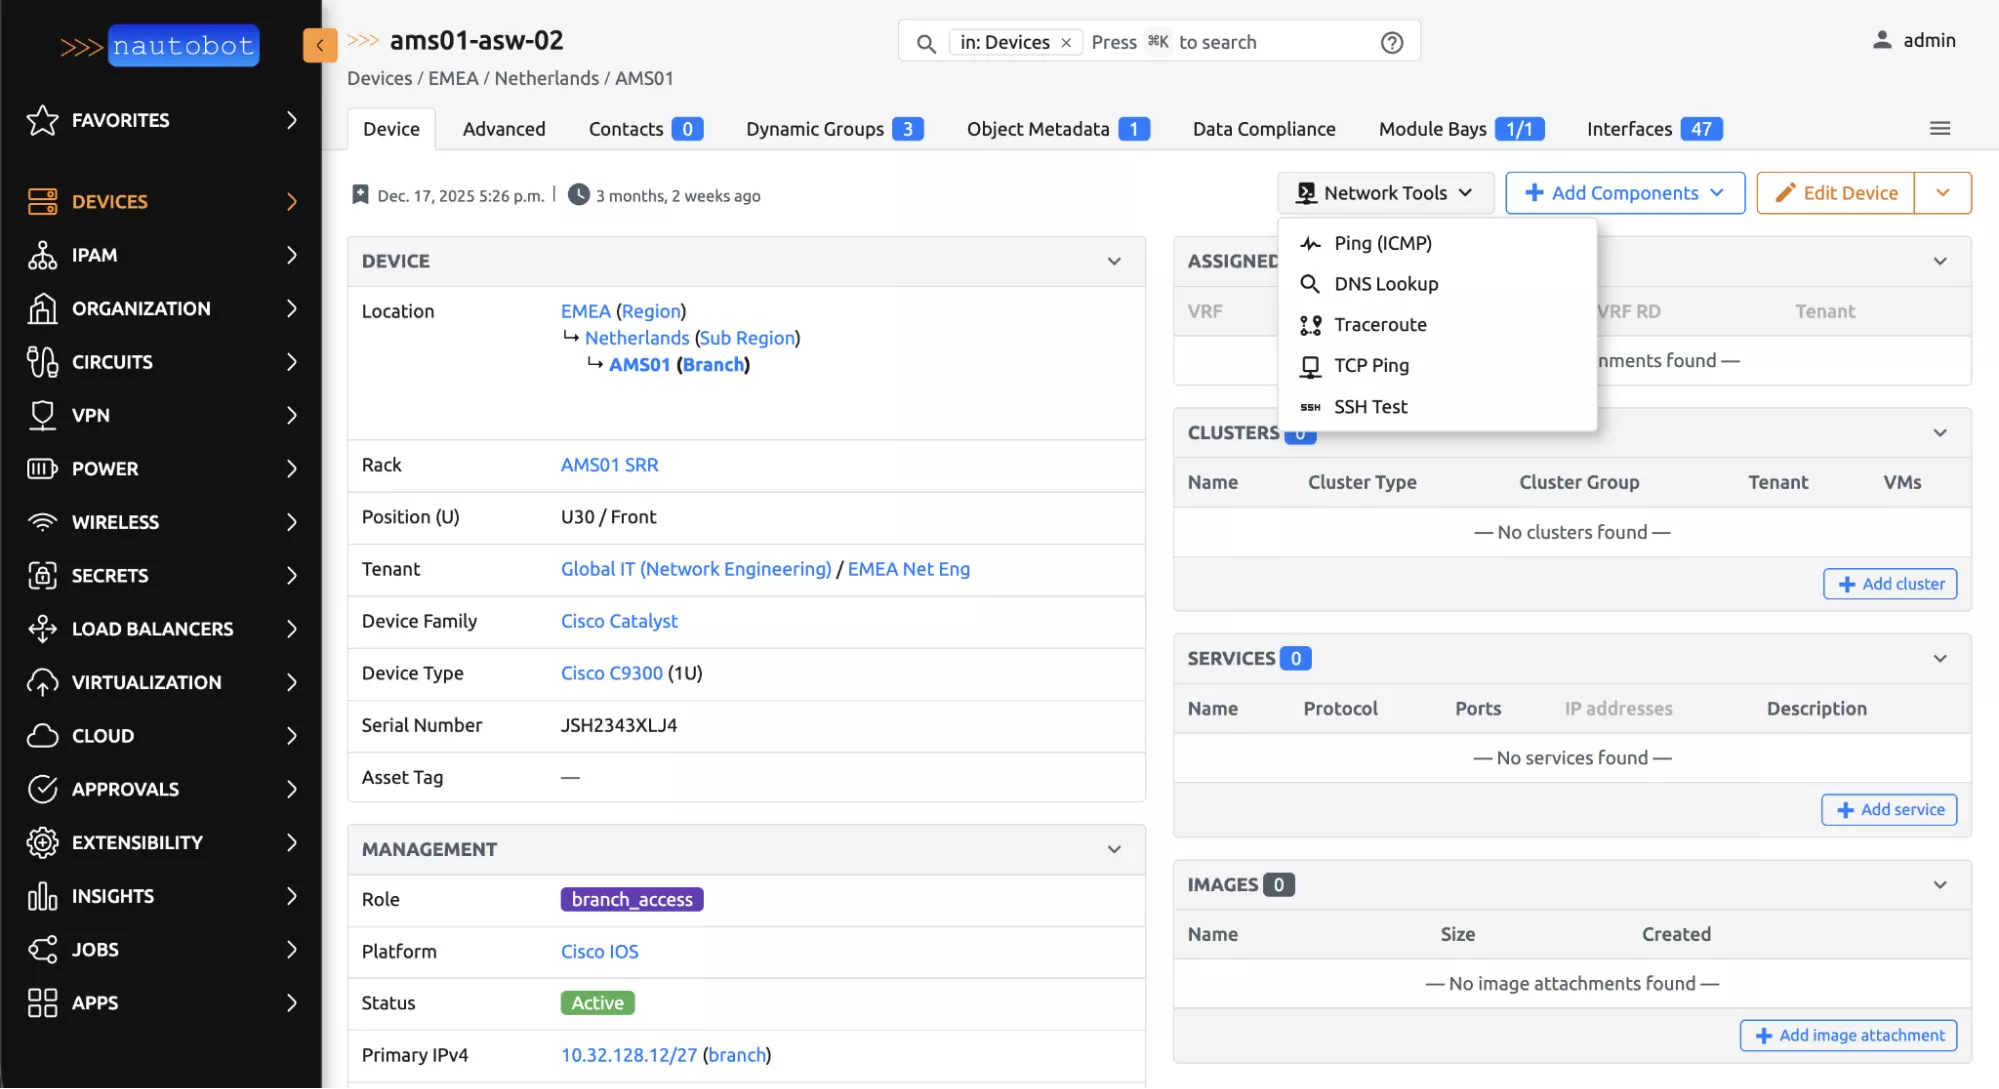
Nautobot Professional introduces integrated network tools and troubleshooting capabilities directly into the platform, enabling teams to diagnose both network and platform issues without leaving their operational workflow.
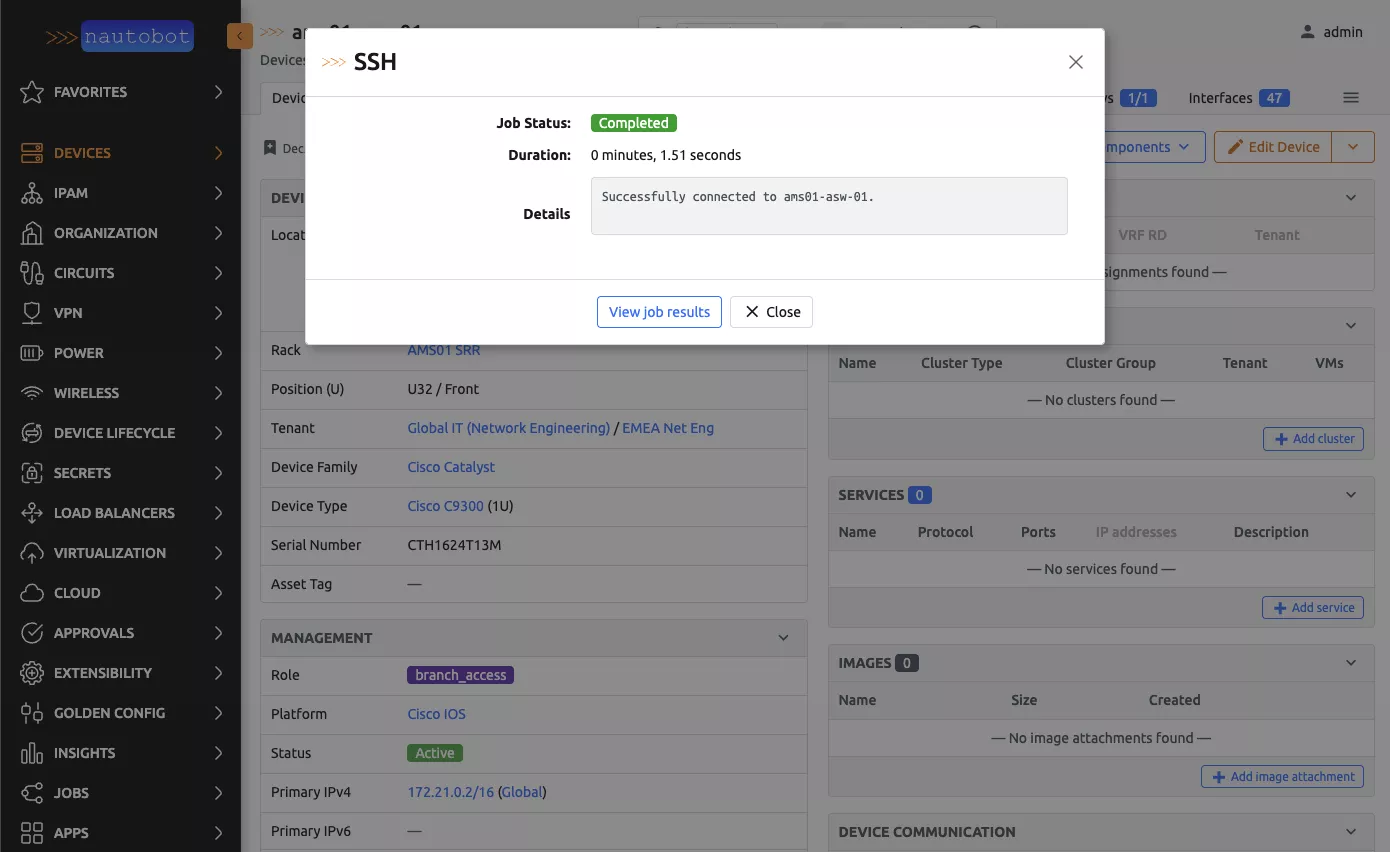
Built-in network tools allow engineers to quickly validate connectivity and investigate device behavior in real time.
Key capabilities include:
These tools eliminate the need to switch to external systems or manual CLI sessions, keeping troubleshooting aligned with your intended state and automation workflows.
When issues arise within Nautobot itself, rapid access to system-level data is critical.
Nautobot Show Tech provides a comprehensive diagnostic snapshot of the platform, including:
This structured output enables faster root cause analysis and simplifies escalation by providing all relevant data in a single, consistent format.
By combining network diagnostics and platform-level visibility, Nautobot enables a more efficient troubleshooting process:
This approach reduces friction, improves consistency, and ensures troubleshooting aligns with your broader NetDevOps practices.
Stop switching tools to diagnose problems.
Bring troubleshooting into your automation platform
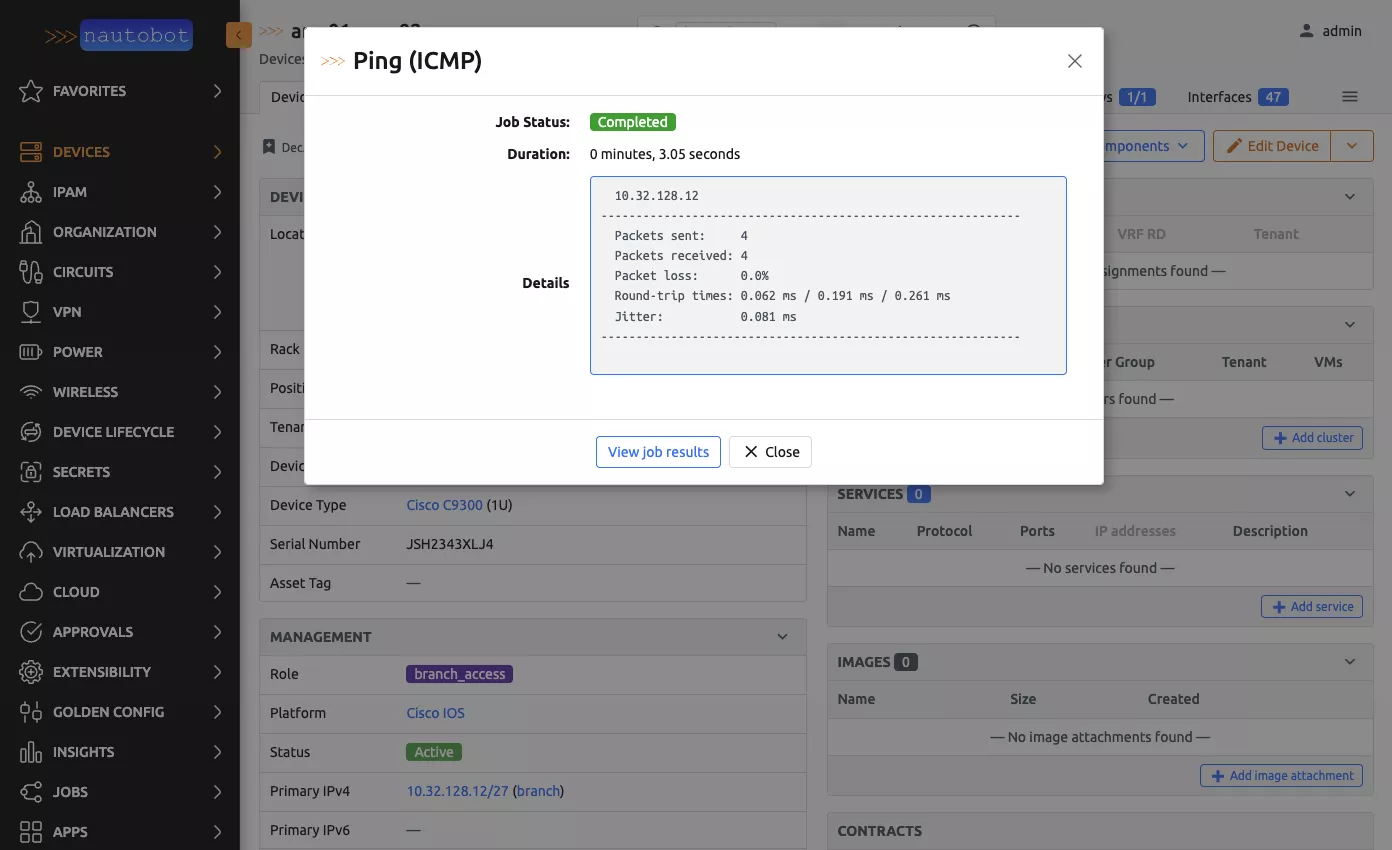
Nautobot provides built-in utilities such as ping, traceroute, and device access validation to quickly test connectivity and investigate issues.
They significantly reduce the need for ad hoc CLI sessions. Engineers can perform the vast majority of common diagnostics directly in Nautobot, limiting CLI sessions to complex, deep-dive scenarios.
Show Tech collects system-level diagnostics including OS details, resource usage, installed packages, Nautobot configuration, and job/service data.
By centralizing diagnostics and eliminating tool switching, engineers can gather relevant data faster and make decisions more quickly.
Yes. They are designed to be used as part of day-to-day operations and during active troubleshooting scenarios.
Yes. Output is structured and consistent, making it easier to analyze and share with internal teams or support.
Yes. They allow real-time interaction for connectivity validation and troubleshooting.
These capabilities operate within Nautobot, ensuring troubleshooting aligns with your intended state, automation pipelines, and data models.


Share details about yourself & someone from our team will reach out to you ASAP!