While teaching a Ansible Network Automation course, one day a student asked if there was a way to visualize Ansible playbooks. My usual response is to ensure they are aware of the --list-tasks command line flag, which will show a playbook’s plays and tasks that belong to those plays in a nicely formatted fashion.
Something else that is good to be aware of that came recommended by another student is a way of viewing a similar type of information, but displayed differently, and more visually pleasing, is called Ansible Playbook Grapher.
Note:
--list-taskscomes already built-in with Ansible andAnsible Playbook Grapherhas only been tested with Ansible >= 2.7 and needs to be installed with it’s dependencies. Click here! to view instructions.
Let’s look at a few examples on first using --list-tasks and second using Ansible Playbook Grapher to see what each offer.
This first example is pretty basic. There are two Ansible plays–three tasks belong to Play 1 and a single task on Play 2.
ntc@jump-host:ansible$ ansible-playbook build_push.yml --list-tasks
playbook: build_push.yml

  play #1 (all): BUILD PROCESS	TAGS: [BUILD]
    tasks:
      ENSURE DIRECTORY EXISTS PER DEVICE (AND PARTIALS SUB-DIR)	TAGS: [BUILD]
      BUILD NETWORK CONFIGURATIONS	TAGS: [BUILD]
      ASSEMBLE PARTIAL CONFIGURATIONS PER DEVICE INTO SINGLE CONFIG FILE	TAGS: [BUILD]

  play #2 (all): DEPLOY CONFIGURATIONS USING NAPALM	TAGS: [DEPLOY]
    tasks:
      DEPLOY MERGE	TAGS: [DEPLOY]
Note: The information below is a break down of the output from running the CLI command, if you want to know more about the output.
Right after running the command ansible-playbook build_push.yml --list-tasks in the output it shows:
playbook: build_push.yml <–Playbook nameplay #1 (all) <– What devices are being targeted in play #1BUILD PROCESS <– Name of PlayTAGS: [BUILD] <– Used when running playbook using --tags=BUILDENSURE DIRECTORY EXISTS... <– Task nameTAGS: [BUILD] <– Part of the same tag defined earlierBelow is another example but with more plays and tasks.
ntc@jump-host:ansible$ ansible-playbook lldp_neighbors.yml --list-tasks
playbook: lldp_neighbors.yml

  playbook: lldp_neighbors.yml

  play #1 (all): CREATE DIRECTORIES	TAGS: [common]
    tasks:
      CREATE DIRECTORIES	TAGS: [common]
      CREATE JINJA FILES	TAGS: [common]

  play #2 (iosxe): GET LLDP NEIGHBORS - IOS	TAGS: [ios]
    tasks:
      IOS LLDP NEIGHBORS	TAGS: [ios]
      DEBUG FACTS FOR IOS	TAGS: [ios]
      GENERATE REPORT FOR IOS	TAGS: [ios]

  play #3 (nxos): GET LLDP NEIGHBORS - NXOS	TAGS: [nxos]
    tasks:
      NXOS LLDP NEIGHBORS	TAGS: [nxos]
      DEBUG FACTS FOR NXOS	TAGS: [nxos]
      GENERATE REPORT FOR NXOS	TAGS: [nxos]

  play #4 (eos): GET LLDP NEIGHBORS - EOS	TAGS: [eos]
    tasks:
      EOS LLDP NEIGHBORS	TAGS: [eos]
      DEBUG FACTS FOR EOS	TAGS: [eos]
      GENERATE REPORT FOR EOS	TAGS: [eos]

  play #5 (vmx): GET LLDP NEIGHBORS - VMX	TAGS: [vmx]
    tasks:
      VMX LLDP NEIGHBORS	TAGS: [vmx]
      DEBUG FACTS FOR VMX	TAGS: [vmx]
      GENERATE REPORT FOR VMX	TAGS: [vmx]
As you can see, the output is clean and provides a view into all plays and tasks extracting all of the name values from the playbook.
This time I’m going to try out the same playbook but using Ansible Playbook Grapher.
ntc@jump-host:ansible$ ansible-playbook-grapher build_push.yml
Graphing Play #1: BUILD PROCESS (2) *****************************************************************************************************************************************

Done graphing Play #1: BUILD PROCESS (2) ************************************************************************************************************************************


Graphing Play #2: DEPLOY CONFIGURATIONS USING NAPALM (2) ********************************************************************************************************************

Done graphing Play #2: DEPLOY CONFIGURATIONS USING NAPALM (2) ***************************************************************************************************************

The graph has been exported to build_push.svg
Again, right after running the command ansible-playbook-grapher build_push.yml the output would look like:
Graphing Play #1: BUILD PROCESS (2) <– Runs a Python file in the background based on the input given from the cliDone graphing Play #1: BUILD PROCESS (2) <– Finishes running the script and exports svg file locally.If you open up the generated file it should look like the following:
On OSX:
ntc@jump-host:ansible$ open -a "Google Chrome" <path-to-svg>

(build_push.yml)(2)("BUILD PROCESS", "DEPLOY CONFIGURATIONS" USING NAPALM TAGS)(Play_1 = 3, Play_2 = 1)(Play_1 = "ENSURE DIRECTORY EXISTS PER DEVICE", "BUILD NETWORK CONFIGURATIONS", "ASSEMBLE PARTIAL CONFIGURATIONS..." Play_2 = "DEPLOY MERGE")Second Example:
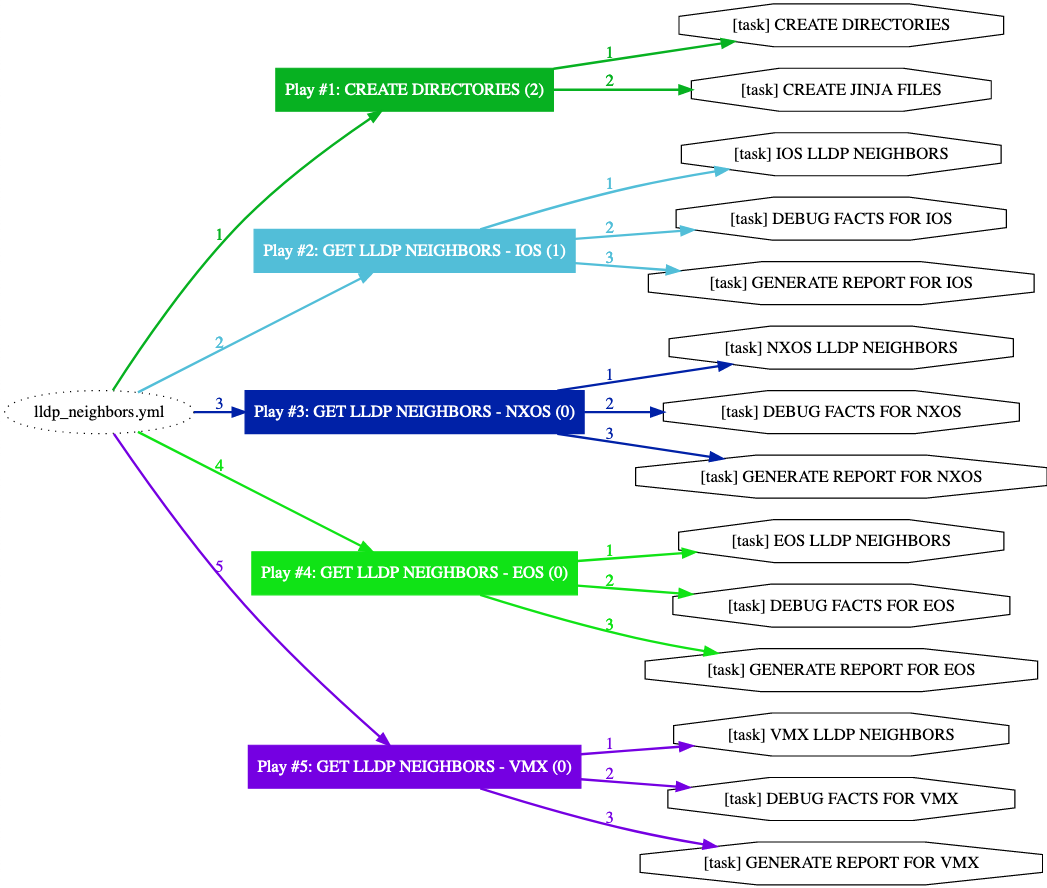
ntc@jump-host:ansible$ ansible-playbook-grapher lldp_neighbors.yml
Graphing Play #1: CREATE DIRECTORIES (12) *****************************************************************************************************************************************************

Done graphing Play #1: CREATE DIRECTORIES (12) ************************************************************************************************************************************************


Graphing Play #2: GET LLDP NEIGHBORS - IOS (3) ******************************************************************************************************************************************************

Done graphing Play #2: GET LLDP NEIGHBORS - IOS (3) *************************************************************************************************************************************************


Graphing Play #3: GET LLDP NEIGHBORS - NXOS (2) ******************************************************************************************************************************************************

Done graphing Play #3: GET LLDP NEIGHBORS - NXOS (2) *************************************************************************************************************************************************


Graphing Play #4: GET LLDP NEIGHBORS - EOS (4) ******************************************************************************************************************************************************

Done graphing Play #4: GET LLDP NEIGHBORS - EOS (4) *************************************************************************************************************************************************


Graphing Play #5: GET LLDP NEIGHBORS - VMX (3) ******************************************************************************************************************************************************

Done graphing Play #5: GET LLDP NEIGHBORS - VMX (3) *************************************************************************************************************************************************

The graph has been exported to lldp_neighbors.svg

So if I change the names on some of the tasks and remove the specifics on what OS they belong to you will see a much different graph.
To be more specific I changed the task names from:
DEBUG FACTS FOR IOS
GENERATE REPORT FOR IOS
to this on each vendor:
DEBUG FACTS
GENERATE REPORT
The result of this change generated this type of output:
To view the source code and find other details like prerequisites and installation about this tool, find it at: https://github.com/haidaraM/ansible-playbook-grapher
-Hector
Share details about yourself & someone from our team will reach out to you ASAP!