Eliminate blind spots. Turn network data into actionable visibility
Gain immediate, visual insight into inventory, lifecycle, and automation, all powered directly by your Nautobot data. Insights delivers prebuilt charts and reports helping engineers and leaders understand what’s happening in the network without building custom tooling.
Instead of stitching together reports or exporting data into external BI tools, teams can explore their environment directly within Nautobot using structured, up-to-date dashboards.
Modern network teams generate vast amounts of data, but struggle to turn that data into clear, actionable insight.
Inventory is distributed across systems. Lifecycle data is incomplete or outdated. Automation activity is difficult to measure beyond logs and job results. As a result, teams often rely on spreadsheets, ad hoc scripts, or external reporting tools to answer basic operational questions:
These gaps create friction across both engineering and leadership. Engineers lack visibility into operational trends. Leaders lack a reliable, real-time view of infrastructure health. And most importantly, teams cannot confidently scale automation without understanding its impact.
Traditional approaches fall short because they operate outside the system of record. They introduce delays, inconsistencies, and additional maintenance overhead.
Bottom line:
Lack of visibility is costing you time and control. If you cannot easily visualize your network data, you cannot effectively operate or scale your NetDevOps practices.
Continuous, Confident Operations. With Nautobot Insights, network teams move past fragmented reporting to achieve continuous visibility.
Engineers can quickly understand the current state of the network without writing queries or scripts. Platform teams gain confidence in automation performance by tracking execution trends and success rates. Leadership gains a clear, real-time view of infrastructure health and risk, knowing that all data is sourced directly from Nautobot—your Network Source of Truth (NSoT).
Because Insights is built directly into Nautobot, all data reflects the current state of the system of record, eliminating delays and inconsistencies.
Key benefits:
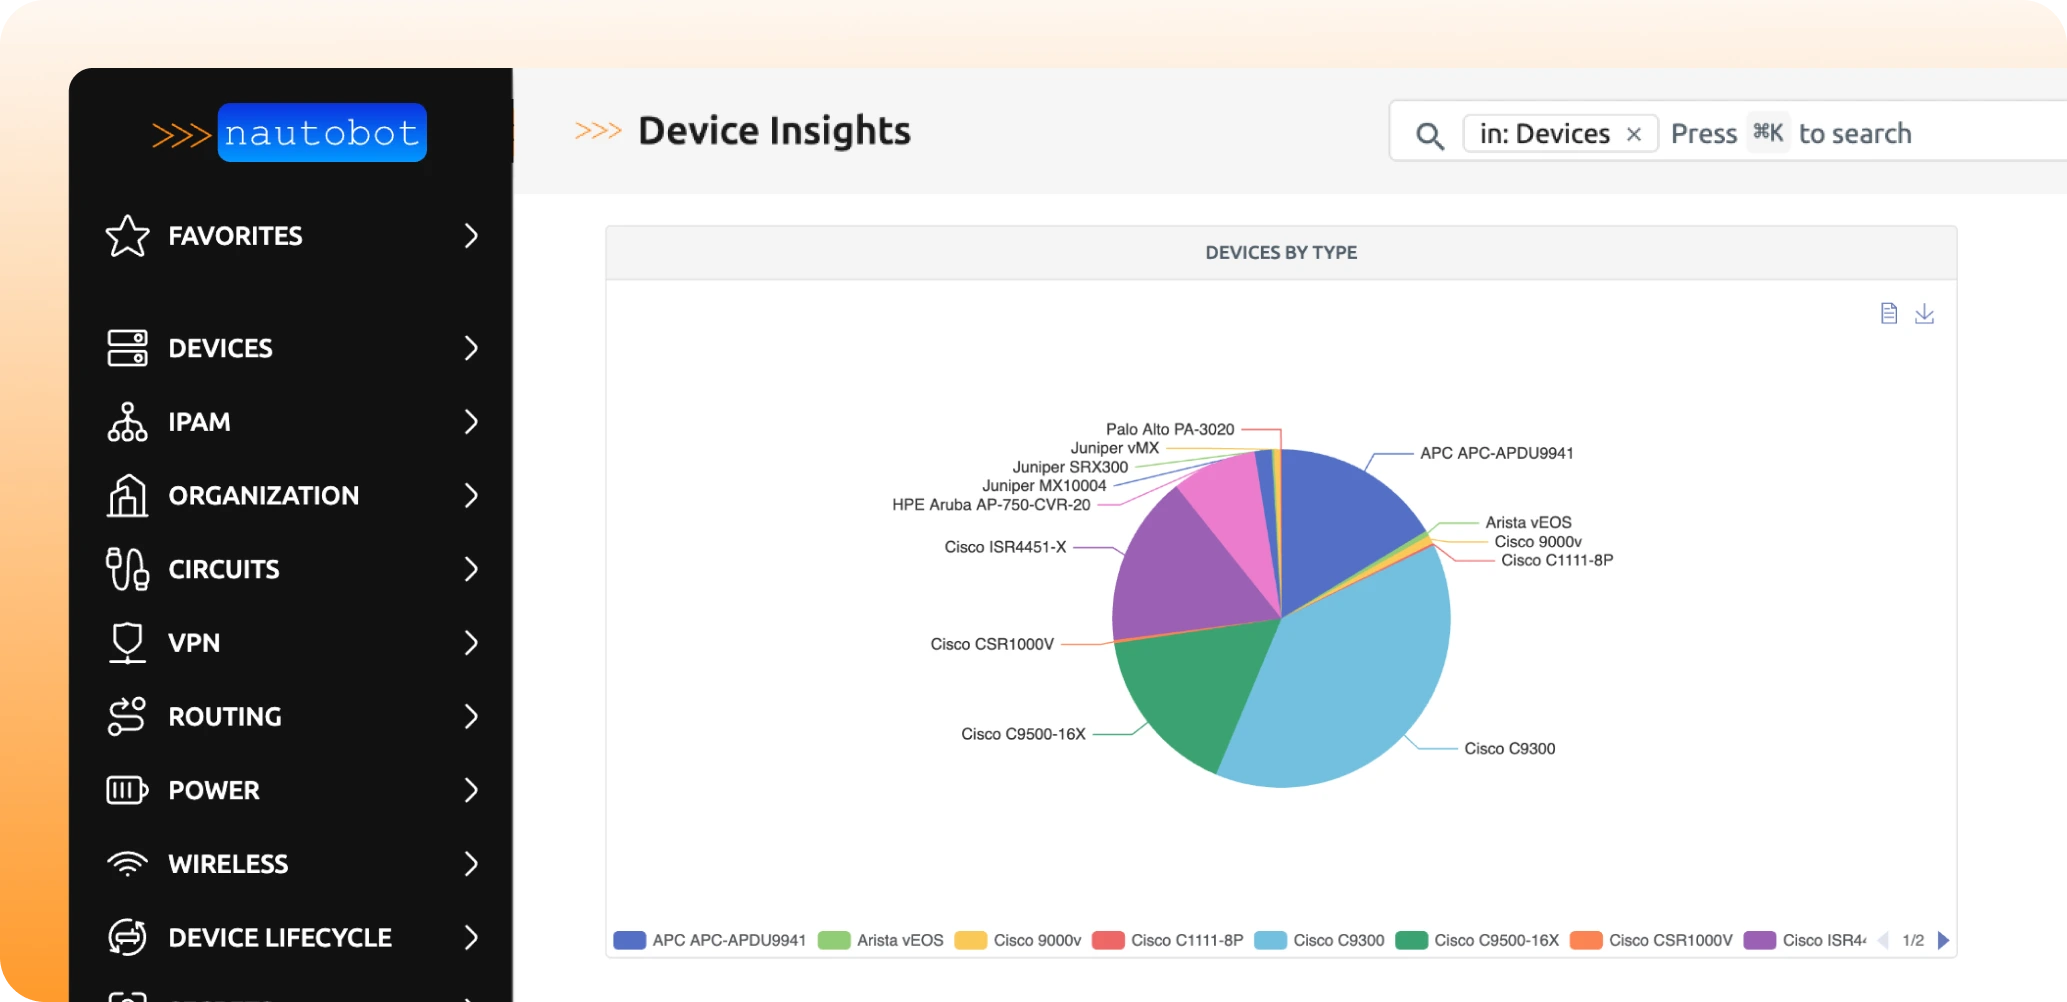
Insights is the built-in, structured solution for immediate network visualization. Nautobot data is automatically translated into intuitive, prebuilt dashboards across three core domains, eliminating the need for custom development or external BI tools.
Rather than requiring custom development or external tools, Insights organizes key operational data into intuitive dashboards across three core domains.
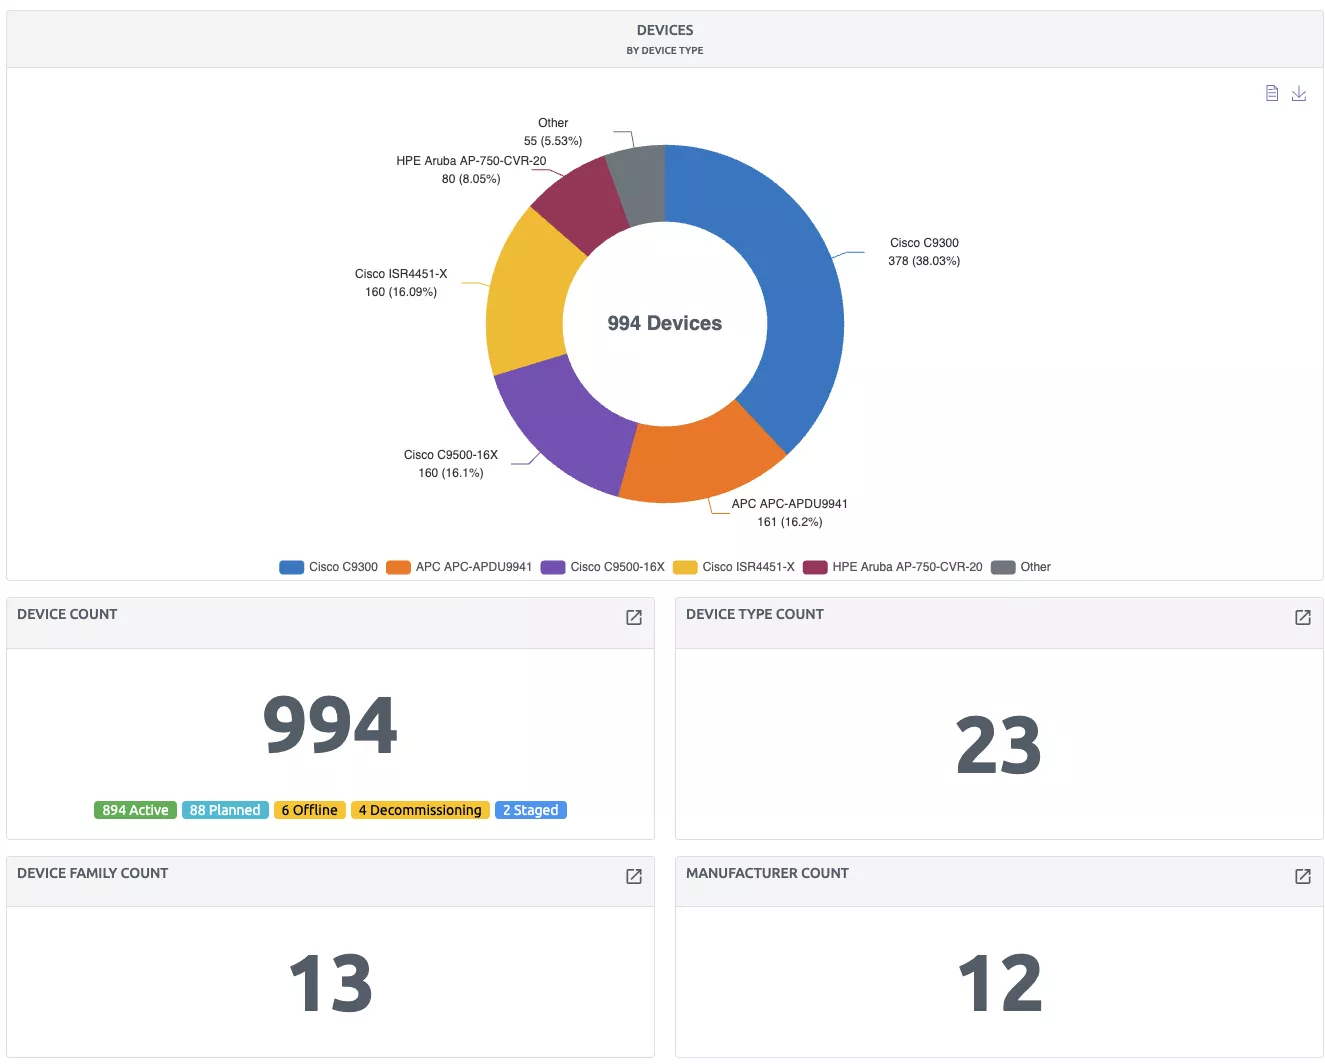
Understand the composition and structure of your network at a glance.
Charts are grouped logically, and zero-value data is excluded to reduce noise and improve clarity.
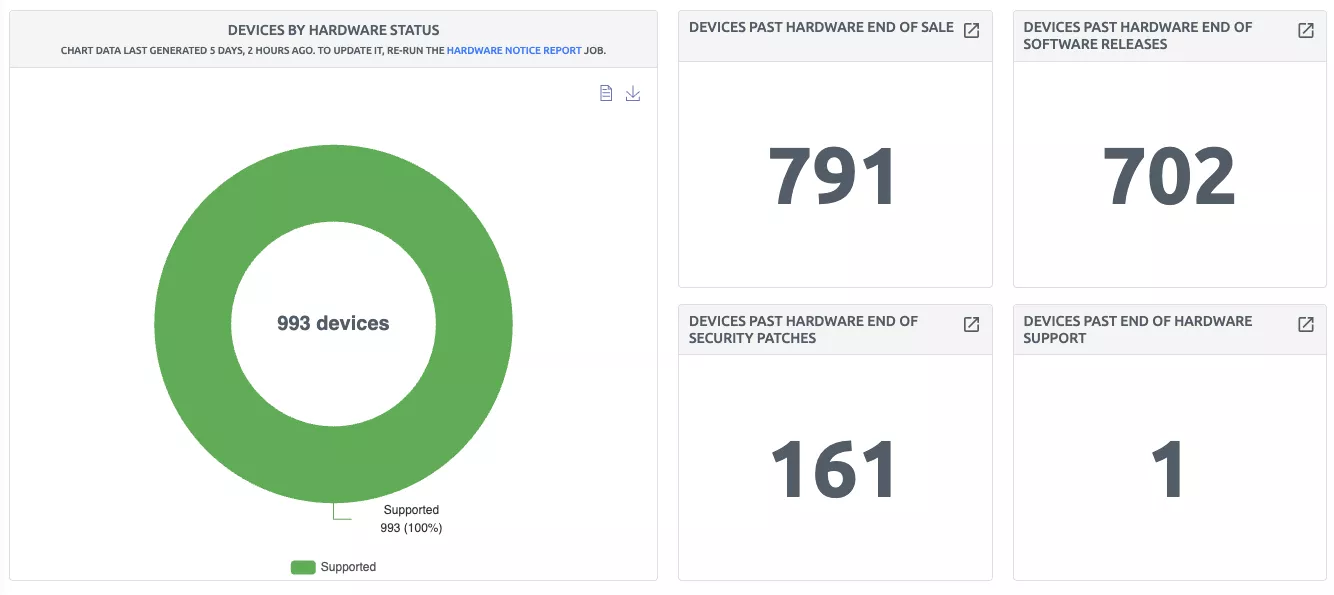
Track hardware and software lifecycle status to reduce operational risk.
This enables teams to proactively manage risk instead of reacting to outages or audit findings.
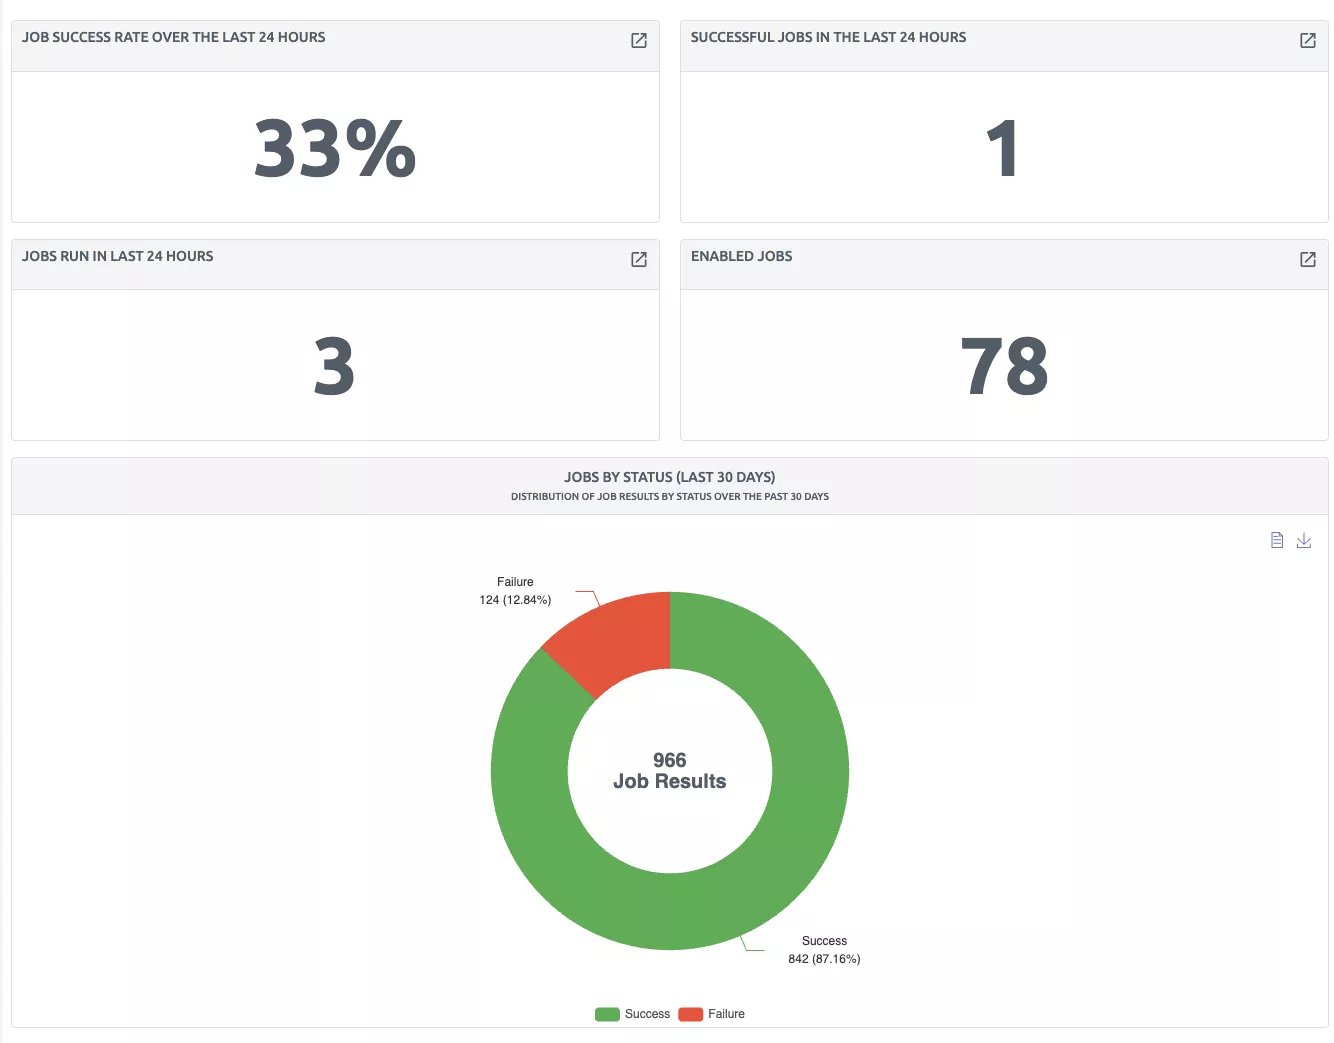
Measure how automation is performing across your environment.
Time windows are configurable, allowing teams to analyze both recent activity and longer-term trends.
Ready for continuous visibility and actionable info?
Explore Insights in Nautobot Professional today.
Insights is a dashboard feature that provides prebuilt visualizations of network data, including inventory, lifecycle status, and automation activity.
No. Insights includes prebuilt charts and dashboards designed around common network operational needs.
All data is sourced directly from the Nautobot database, ensuring it reflects the current system of record.
Yes. For example, device-related reports can be filtered by attributes such as location, status, manufacturer, role, device type, and tenant.
It highlights devices that are end-of-life, out of support, or not covered by contracts, allowing teams to proactively manage risk.
Insights tracks job activity, execution counts, success rates, and trends over time, helping teams evaluate automation performance.
Insights is included in Nautobot Professional, with additional functionality available in Nautobot Enterprise.
Insights eliminates the need to export data and maintain separate reporting pipelines by providing built-in, real-time dashboards within Nautobot.
Yes. By visualizing automation activity and success rates, Insights provides measurable data that supports operational and strategic decisions.


Share details about yourself & someone from our team will reach out to you ASAP!