Nautobot Ansible Variable Management at Scale

Blog Detail

Ansible’s variable management system is fairly extensible, however the cost of that extensibility and associated design choices can cause some inefficiencies when interacting with external systems. Specifically, it can become rather time consuming to get all of the data a playbook requires at run time. Leveraging Nautobot’s GraphQL and Nautobot Ansible collection, we will explore what an optimal solution would be.

A Quick Lesson in Ansible Inventory

Initially Ansible had created an Ansible Dynamic Inventory, which was a script that would print to the terminal a JSON serializable structure in a specific format. Once Ansible 2.4 was released, there was support for Ansible Inventory Plugins, which provide a more object-oriented and Pythonic experience, as well as a separation of the configuration (generally via YAML files) from the inventory itself.

With both of these dynamic inventory types as well as any static inventory, the inventory must be compiled before the play runs. This means that all inventory and variables are collected before a playbook is run. If your playbook requires a connection to only a single device and needs a single configuration parameter, this would still require the entire inventory and variables to compile, which is the same as if the playbook had to connect to thousands of devices for dozens of variables each.

This design certainly has its advantages, such as Ansible’s use of the hostvars (not to be confused with host_vars) magic variable. Meaning, even if you need to connect to a only single device, you can still have access to another device’s variable. This would allow you to do something like:

  - name: "SET SPINE_INTERFACE BY LOOKING INTO THE SPINES VARIABLE STRUCTURE"
    set_fact:
      spine_interface: "{{ hostvars[inventory_hostname[:5] ~ 'spine01']['interface_mappings'][inventory_hostname] }}"

However, such a requirement is not often needed, and it is perfectly valid to provide an alternative solution without such a feature, as we will explore.

The Speed Issue

It is obvious that the standard design causes a host of speed issues when not all variables are required. Within Nautobot, to collect all of the interfaces and config context of thousands of devices could literally take hours. This is because the queuing mechanism looks something like:
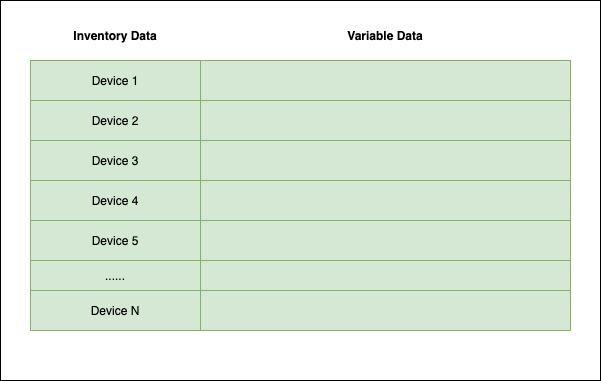
Speed Issue

In this example, it could potentially take hundreds or even thousands of API calls before the first task runs, and all of that data needs to be stored in memory. This is true even if the only data we require actually looks like:
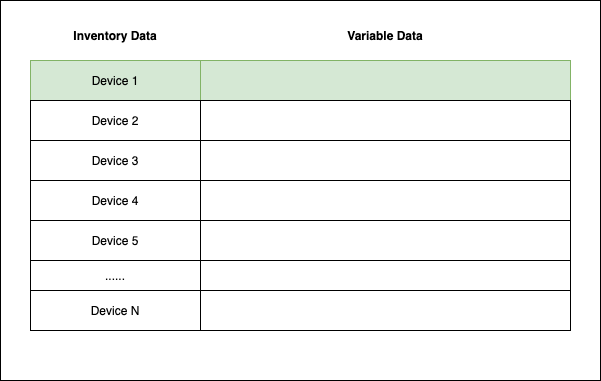
Speed Issue

GraphQL to the Rescue

Recognizing the speed issues, at Network to Code we have worked with our customers for years on various work-arounds, which was one of the drivers to introducing GraphQL to Nautobot. What we have observed from dozens of engagements with our customers is:

  • Playbooks rarely need access to all data
  • There is generally a single “generate configuration” playbook that does need access to all data
  • There are usually different ways data may need to be requested
  • Managing separate inventories is complicated and leads to issues
  • The primary issue is the way in which data is queued, with Ansible expecting all data to be queued beforehand

With that in mind, we looked to change the way that variables are populated; this is different from saying we looked to change how the inventory plugin works. The basic premise is to get the bare minimum inventory from the inventory plugin, then populate the data within the play itself. The direct benefit is that inventory does not require nearly the amount of data (which must be present before any task in the play is run) before starting. And we have also distributed the amount of data to be smaller API calls made while the play is running. Additionally, if we do not need all data, we simply do not need to get that data at all.

It is in that second step that GraphQL really shines. GraphQL provides a single API that can be called to send only the data that is required. There is a lookup and an Ansible module within Nautobot’s Ansible Collection. This means that we can use a single inventory setup for all of our playbooks and have specific tasks to get the data required for specific playbooks. We can also change the majority of the API calls to happen per device rather than all up front. This has a significant performance impact, as bombarding the server with hundreds or thousands of API calls at once can cause performance issues—not only for the user of Ansible, but potentially deteriorating the performance of the server for everyone else.
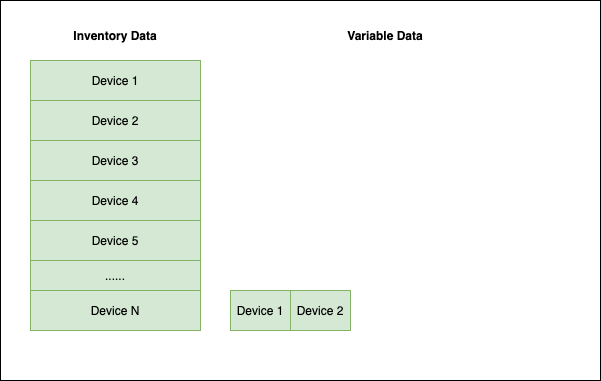
Rescue

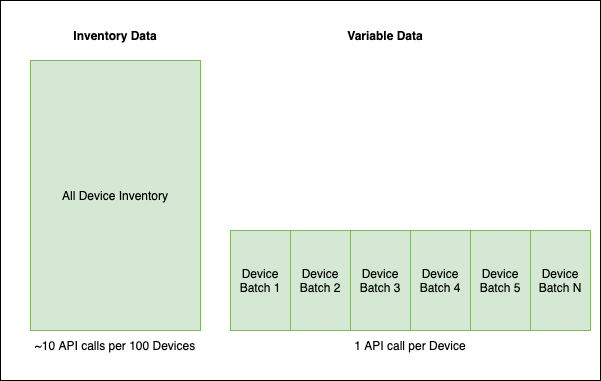
Even when you do require all of the data, it looks more like this (where time is left-to-right and scaled to your actual needs):
Rescue

Note: The depicted batch size is equal to the fork size you have chosen. There are also alternative Ansible strategies one can explore outside the scope of this blog.

Note: The API calls shown are not meant to represent the actual amount a production instance may have, but merely to illustrate the point.

Example Playbook and Inventory

So let’s take a look at what such a playbook and inventory may look like.

plugin: networktocode.nautobot.inventory
api_endpoint: "https://demo.nautobot.com"
validate_certs: False

config_context: False
plurals: False
interfaces: False
services: False
racks: False
rack_groups: False

compose:
  device_id: id

group_by:
  - site
  - tenant
  - tag
  - role
  - device_type
  - manufacturer
  - platform
  - region
  - status

A playbook to obtain and populate the data could look like:

---
- name: "TEST NAUTOBOT INVENTORY"
  connection: "local"
  hosts: "all"
  gather_facts: "no"

  tasks:
      - name: "SET FACT FOR QUERY"
        set_fact:
          query_string: |
            query ($device_id: ID!) {
              device(id: $device_id) {
                config_context
                hostname: name
                position
                serial
                primary_ip4 {
                  id
                  primary_ip4_for {
                    id
                    name
                  }
                }
                tenant {
                  name
                }
                tags {
                  name
                  slug
                }
                device_role {
                  name
                }
                platform {
                  name
                  slug
                  manufacturer {
                    name
                  }
                  napalm_driver
                }
                site {
                  name
                  slug
                  vlans {
                    id
                    name
                    vid
                  }
                  vlan_groups {
                    id
                  }
                }
                interfaces {
                  description
                  mac_address
                  enabled
                  name
                  ip_addresses {
                    address
                    tags {
                      id
                    }
                  }
                  connected_circuit_termination {
                    circuit {
                      cid
                      commit_rate
                      provider {
                        name
                      }
                    }
                  }
                  tagged_vlans {
                    id
                  }
                  untagged_vlan {
                    id
                  }
                  cable {
                    termination_a_type
                    status {
                      name
                    }
                    color
                  }
                  tagged_vlans {
                    site {
                      name
                    }
                    id
                  }
                  tags {
                    id
                  }
                }
              }
            }

      - name: "GET DEVICE INFO FROM GRAPHQL"
        networktocode.nautobot.query_graphql:
          url: "{{ nautobot_url }}"
          token: "{{ nautobot_token }}"
          validate_certs: False
          query: "{{ query_string }}"
          update_hostvars: "yes"
          graph_variables:
            device_id: "{{ device_id }}"

The above shows update_hostvars set, which will publish the variables for any playbook task after this point. Within a playbook that starts like the above, you would have access to the data. If the playbook did not have any requirements for the above data, you would simply not include such tasks.

Life without GraphQL

Without GraphQL the same can still be accomplished. In the past at Network to Code, we have used Ansible custom modules. Within the custom module you can populate the ansible_facts key, which will actually update the data associated with a device. So if a custom Ansible module had the below code:

    results = {"ansible_facts": {"ntp": ["1.1.1.1", "2.2.2.2"]}}
    module.exit_json(**results)

you could have access to the data in the playbook as usual, such as:

  - debug: var=ntp

Inventory Recommendations

If you will notice in the example inventory, the inventory is minimal. The basic premise is that you should disable any data not required to create groups and, generally speaking, retain only the minimum amount of information required to connect to the device, such as IP address and network OS.


Conclusion

Changing the queuing mechanism has dramatic effects on the overall speed, and Nautobot’s ecosystem was built to take advantage of these capabilities. But that is not the only way to work this, as you could build a custom module as well. When thinking about performance and scalability of the data, you should consider a lightweight inventory and more detailed data on a task level.

-Ken Celenza


ntc img
ntc img

Contact Us to Learn More

Share details about yourself & someone from our team will reach out to you ASAP!

NetDevOps Concepts – Infrastructure as Code

Blog Detail

Welcome to the third in our series of posts about NetDevOps concepts! We have previously done an introductory post, as well as one on the concept of Minimum Viable Product, so be sure to check those out if you haven’t already!

In this post we’re going to dive into the concept of Infrastructure as Code or IaC, and how it can be applied to your network.

Infrastructure as Code is a commonly used DevOps term for managing or provisioning equipment in your infrastructure via an automated and repeatable process. This means that your infrastructure is always maintained in a known and pre-defined state, which allows you to utilize and enforce best practices across your entire infrastructure with ease.

In addition, adhering to Infrastructure as Code principles ensures that your infrastructure is less prone to unexpected or unplanned changes. Even if someone did change the infrastructure manually, and cause a negative impact, you are able easily and immediately re-apply the known/good state to restore service.

Your security team will thank you as well, because being able to uniformly ensure that good, secure, configurations are in place on your equipment makes their jobs tremendously easier.

The Pillars of Infrastructure as Code

In order to build an Infrastructure as Code based NetDevOps solution in your own network, it is essential to understand the key underlying components, or pillars, of Infrastructure as Code. A firm grasp on the pillars, how they interact, and which tools belong in which pillar, will allow you to craft a powerful and robust IaC solution in your environment.

Infrastructure as Code is usually built upon four key pillars.

  1. Source of Truth (SoT) – SoT is often a combination of the following components:
  2. CI/CD – CI/CD stands for Continuous Integration and Continuous Deployment or Delivery and describes systems used to manage and execute the changes to, or deployment of, your infrastructure.
  3. Tests – Tests allow you to go forward with the faith that changes executed by this process will be successful and not cause unwanted or unintended changes to your infrastructure.
  4. Deployment and Configuration Tools – These tools are varied and can take many forms depending on the IaC system being built. For NetDevOps these will frequently be tools or systems that can talk to the management plane of the network (via SSH or HTTPS) to implement changes.

If we were building the Infrastructure as Code “house”, consider Source of Truth to be the blueprints. The CI/CD system is the Foreman or General Contractor overseeing construction, and Tests are the Building Inspector. Your Deployment and Configuration Tools are the Electrician, Plumber, and Carpenter who build the house!

There are many potential combinations of Source of Truth, CI/CD, Testing and Deployment tools, so don’t worry if the possibilities initially seem overwhelming. For example, Source of Truth and CI/CD will have entire dedicated articles in this series. To assist with becoming more familiar with the tools available to you, at the end of this post we have collected an Appendix called “Lay of the Land” with tools in each of these pillars and links for further research.

An Example of the Pillars in Action

If we think about the IaC pillars, we can construct an example scenario using them to illustrate each pillar’s purpose in an overall Infrastructure as Code deployment.

A system built on these pillars often utilizes configuration and metadata files, kept in a Source Control system such as Git, to generate device configurations based on facts kept in a System of Record/DCIM such as NetBox. Together these elements form the Source of Truth for a portion of the infrastructure. Engineers would make changes to a file or files in Git to describe the desired changes to the state of the infrastructure. Prior to these changes being implemented on the infrastructure, they would require a peer review, and for any tests run by the CI/CD system to pass.

When these proposed changes are made to the relevant area of your Source of Truth, a CI/CD tool such as Jenkins will detect or be notified of the changes. The CI/CD tool will then execute a series of steps (often called a “pipeline”) to properly test these proposed changes to the infrastructure.

Inside the pipeline, tests are executed before any infrastructure changes are made, to validate their potential for success and any impact they may cause. Simple tests are commonly used to validate (or “lint”) that the changed files themselves are syntactically and logically valid. In addition, in a Network IaC pipeline, tests are often run with a tool such as Batfish which can analyze and understand network device configuration. These advanced tests allow you to validate potential changes will not affect an unexpected element of your network. They allow you to, in advance of touching the network itself, be confident that these changes will not cause adverse impact or unintended security policy changes. Pass or fail, the status of these tests are reported back to Git for display, or can be passed to a chat platform such as Slack.

If the tests are successful, and in this example the changes are approved and merged in Git, the changes are then able to implemented via a Deployment Tool, such as Terraform or Ansible (or both), or even plain Python. This step does not have to happen immediately, and the pipeline in your CI/CD tool can easily be made to wait until a pre-determined change window to execute the pending changes. Once the pipeline is ready to deploy the changes or infrastructure itself, the Deployment Tool will deploy or configure elements of your infrastructure based upon the changes recorded, approved, and tested, from the Source of Truth.

And finally, tests are executed once again to determine the success of the deployment actions. If these tests fail, they can either rollback the executed changes, or alert an engineer that some sort of intervention is needed via a message in Slack.

Network Infrastructure as Code

When speaking specifically about bringing Infrastructure as Code into the NetDevOps world, there are two common types of use cases.

The first type is utilizing IaC to deploy virtual network infrastructure itself. This would include for example, automatically provisioning an AWS VPC to terminate VPNs for your organization or spinning up a virtual firewall appliance in ESX.

The second type is utilizing IaC to deploy configurations to your existing network infrastructure (including physical equipment). This could be keeping the list of your BGP peers in a file in Source Control, and then applying the appropriate configuration to the routers in your network when changes are made to this file.

Determining which of these two areas you wish to work on first will be up to you, although most commonly in enterprise networks we see the later pursued (configuration of physical equipment) as it is the largest opportunity to have an impact on day-to-day operations. Removing the need to manually configure VLANs, and simply making a change to a file under Source Control with a CI/CD tool doing the rest, is extremely attractive to many organizations.

Infrastructure as Code and You

If you are feeling a little dazed and confused by all the ways that you can potentially bring Infrastructure as Code principles into your network, you’re not alone. There are many websites, blogs, or YouTube videos that can take you through the next steps on your NetDevOps journey. Or, you could always drop an email to us here at Network to Code as this is our bread and butter, and we’d be more than happy to help you take the next steps.

-Brett


Appendix: Lay of the Land

This is a listing (in no specific order) of commonly used tools in each of pillar to help you begin to organize them in your mind. It is worth noting two things about the below list. First, this is by no means exhaustive and intended simply to help you orient yourself among the plethora of tools that exist in each pillar. Wikipedia has long lists of common Source Control softwareopen-source configuration management tools, and other Infrastructure as Code Tools if you wish to dive deeper.

Secondly, some tools (such as Github or GitLab) appear in multiple pillars below as they provide multiple areas of functionality. This has happened more often in the past few years as, for example, closer integrations of Source Control and CI/CD have become standard features. Nothing is written in stone that says simply because you utilize GitHub for Source Control, you also have to utilize it for CI/CD. Evaluate each tool based on its strengths as well as you and your organization’s experience/familiarity with it.

Source of Truth

Given that a Source of Truth in practice is usually aggregated from several places, I’ve broken it out below into sections for Source Control and for Systems of Record. The relevant Systems of Record in an enterprise environment are often CMDB/DCIM (Configuration Management Database/Data Center Infrastructure Management) tools, so those are covered below.

Source Control

While Git is, by far, the most commonly used Source Control system (with many different services and implementations as shown below), it is good to understand some of the other Source Control tools available as well.

System of Record

Frequently in the System of Record category, there will be multiple of these inside a large organization. Not all elements of the network infrastructure are represented in each system, and some may be syncing data between themselves. In addition, while a CMDB or a DCIM serve different purposes in an environment, there is overlap in the data they may have, and thus can fill some of the same role in an Infrastructure as Code deployment. Some large enterprises have even built their own DCIM or CMDB tools in house, and integration with those tools will vary widely.

CI/CD

There is no clear winner in the CI/CD pillar, so we would recommend learning if one of the below is in existing use inside your organization and attempt to leverage it for your purposes.

Deployment and Configuration Tools

This pillar is very diverse, as the Deployment and Configuration tool you choose largely depends upon your use cases. It can be driven by what type of infrastructure you’re wishing to deploy/configure, how you wish to configure it, or even existing familiarity with a given tool.

It is worth calling out that there are a series of Python tools/libraries that are commonly utilized (frequently in combination) for building custom configuration tools for network equipment as well:

Testing Tools and Frameworks

Testing can take on many varieties and flavors, but for Network Infrastructure as Code the tools you use largely fall into three camps.

First are tools that lint/validate the configuration or code files themselves statically. That means tools which examine the contents of each file and insure, for example that the file claiming to be YAML formatted, really is valid YAML.

Second are tools that spin up infrastructure to allow you to test a simulacrum of your network. These tools, commonly used for training and educational opportunities, were traditionally the main way network changes were validated before the third category appeared.

Third, and the most exciting, are tools that validate the logic of the configuration changes you are attempting to make. These tools will actually analyze the change you are making and it’s potential impact to other elements of your infrastructure.


ntc img
ntc img

Contact Us to Learn More

Share details about yourself & someone from our team will reach out to you ASAP!