pdb – How to Debug Your Code Like a Pro

Blog Detail

Raise your hand if you still remember the first time you ever used print() for debugging your code! Perhaps it’s still the case today? Stare at the traceback, find the faulty line number, and insert a print statement just above it hoping to shed some light on the error. Although that’s a simple method, it has never been a very efficient one: the print() statement has to be moved to the next line… and the next one… and the next one… with no option to move around the code in an interactive way or play around with the imported libraries or functions. What about flooding your code in frustration with thousands of prints? There must be a better way to do it, right?

Fortunately, the community has come to our rescue with an amazing library called pdb — The Python Debugger. While you can use pdb as a regular library where you pass arguments—for an example, look at pdb.post_mortem()—we are mainly interested in the interactive debugging mode.

Let’s take a basic example using the NTC open source library—jdiff:

from jdiff import CheckType, extract_data_from_json

def pre_post_change_result(reference, comparison):
    """Evaluate pre and post network change."""    
    path = "result[*].interfaces.*.[$name$,interfaceStatus]"
    reference_value = extract_data_from_json(reference, path)
    comparison_value = extract_data_from_json(comparison, path)

    my_check = CheckType.create(check_type="exact ")
    return my_check.evaluate(reference_value, comparison_value)


if __name__ == "__main__":
    reference = {
      "result": [
        {
          "interfaces": {
            "Management1": {
              "name": "Management1",
              "interfaceStatus": "connected",
                }
            }
        }
      ]
    }
    comparison = {
      "result": [
        {
          "interfaces": {
            "Management1": {
              "name": "Management1",
              "interfaceStatus": "down",
                }
            }
        }
      ]
    }
    pre_post_change_result(reference, comparison)

When I run the above code, however, I get a NotImplementedError:

<span role="button" tabindex="0" data-code="Traceback (most recent call last): File "/Users/olivierif/Desktop/test.py", line 38, in
Traceback (most recent call last):
  File "/Users/olivierif/Desktop/test.py", line 38, in <module>
    print(pre_post_change_result(reference,comparison))
  File "/Users/olivierif/Desktop/test.py", line 8, in pre_post_change_result
    my_check = CheckType.create(check_type="exact")
  File "/usr/local/lib/python3.10/site-packages/jdiff/check_types.py", line 29, in create
    raise NotImplementedError
NotImplementedError

Let’s see how we can debug the above code using pdb. My favorite way is to insert a breakpoint() line in the code, enter in debug mode, and move around from there.

New in version 3.7: The built-in breakpoint(), when called with defaults, can be used instead of import pdb; pdb.set_trace().

def pre_post_change_result(reference, comparison):
    """Evaluate pre and post network change."""  
    breakpoint()
    path = "result[*].interfaces.*.[$name$,interfaceStatus]"
    reference_value = extract_data_from_json(reference, path)
    comparison_value = extract_data_from_json(comparison, path)
    my_check = CheckType.create(check_type="exact")

    return my_check.evaluate(reference_value, comparison_value)

As soon as I run the code, the execution pauses and I am dropped into Python interpreter where the breakpoint() line was added. As we can see from the below output, pdb returns the code filename and directory path, the line and line number just below breakpoint(). I can now move around the code and start debugging…

> /Users/olivierif/Desktop/test.py(6)pre_post_change_result()
-> path = "result[*].interfaces.*.[$name$,interfaceStatus]"

Let’s move closer to the line number returned by the traceback. Typing n as next, will move pdb to the next line—line number 7.

(Pdb) n
> /Users/olivierif/Desktop/test.py(7)pre_post_change_result()
-> reference_value = extract_data_from_json(reference, path)

What if we want to print, for example, one of the function arguments or a variable? Just type the argument or variable name… Be aware, though, that the terminal must have passed the line where your variable is defined. pdb knows about only the code that has been through already.

(Pdb) reference
{'result': [{'interfaces': {'Management1': {'name': 'Management1', 'interfaceStatus': 'connected'}}}]}
(Pdb) my_check
*** NameError: name 'my_check' is not defined
(Pdb)

Let’s now use j to jump to the fault code line. Before doing that, let’s see where we are in the code with l as list.

(Pdb) l
  2  
  3     def pre_post_change_result(reference, comparison):
  4         """Evaluate pre and post network change."""
  5         breakpoint()
  6         path = "result[*].interfaces.*.[$name$,interfaceStatus]"
  7  ->     reference_value = extract_data_from_json(reference, path)
  8         comparison_value = extract_data_from_json(comparison, path)
  9         my_check = CheckType.create(check_type="exact")
 10  
 11         return my_check.evaluate(reference_value, comparison_value)
 12 
 (Pdb) j 9
> /Users/olivierif/Desktop/test.py(9)pre_post_change_result()
-> my_check = CheckType.create(check_type="exact")

Note that from line 7 I was able to move directly to line 9 with j 9 where 9 is the line number that I want pdb to move to.

Now the cool bit: In the code above, I am using the evaluate method to build my check type. If you remember the traceback, that was the line that gave me the error. While I am in pdb terminal I can s—as step—into that method and move around it:

(Pdb) s
--Call--
> /usr/local/lib/python3.10/site-packages/jdiff/check_types.py(11)create()
-> @staticmethod
(Pdb) l
  6  
  7     # pylint: disable=arguments-differ
  8     class CheckType(ABC):
  9         """Check Type Base Abstract Class."""
 10  
 11  ->     @staticmethod
 12         def create(check_type: str):
 13             """Factory pattern to get the appropriate CheckType implementation.
 14  
 15             Args:
 16                 check_type: String to define the type of check.
(Pdb) n
> /usr/local/lib/python3.10/site-packages/jdiff/check_types.py(18)create()
-> if check_type == "exact_match":

Wait… what was the argument passed to this method? Can’t really remember. Let’s type a as for args.

Pdb) a
check_type = 'exact_matches'
(Pdb) 

…here we are! The method accepts exact_match string as check type, not exact!

Good, let’s now move pdb until we hit a return or raise line—with r key—so we can see our NotImplementedError line.

(Pdb) r
--Return--
> /usr/local/lib/python3.10/site-packages/jdiff/check_types.py(29)create()->None
-> raise NotImplementedError

Conclusion

As you can see, using pdb is a way more efficient way to debug the code. There are tons of useful functions that can be used in interactive mode, and you can also use it to add useful verbosity to your code. I do invite you to spend some time around docs and play with it. Once you get acquainted with the library, you won’t have any more frustration in debugging your code.

-Federico


ntc img
ntc img

Contact Us to Learn More

Share details about yourself & someone from our team will reach out to you ASAP!

Reviewing Code More Effectively

Blog Detail

I believe that it’s important not only to do code reviews when developing software, but also to really understand why we do code reviews, how to make code reviews useful and effective, and what to look for in a code review.

Why Do We Do Code Reviews?

Fundamentally, a code review serves to answer three questions, loosely in descending order of importance:

  1. Is a proposed change to the code a net improvement to the codebase as a whole?
  2. How might the proposed change be improved upon?
  3. What can the reviewer(s) (more broadly, the team) learn from the proposed change?

I want to especially draw your attention to the nuances of that first question. Code is never perfected, and expecting perfection in a code review can be counterproductive and frustrating to the contributor. The goal of a code review is not perfect code, but better code—the code can always be further improved in the future if it proves necessary to do so. Keeping that in mind can make for more efficient reviewing.

How Do We Make Code Reviews Effective?

As a maintainer of a software project, you should prioritize setting contributors up for successful code reviews. The details may vary depending on the size of the project and its pool of potential contributors, but ideas that generally apply include:

  • Labeling and categorizing open issues (bugs, feature requests, etc.) helpfully, especially in terms of their complexity or any specialized expertise that might be needed to tackle a specific issue. (Many open-source projects use a label such as help wanted or good first issue as a way to highlight issues that would be well-suited for a new contributor to take on, as one example.)
  • Documenting expectations for code contributions clearly, through tools such as GitHub’s “pull request templates” and CONTRIBUTING.md, as well as by providing well-written developer documentation in general.
  • Automating any part of the project’s requirements that can be effectively automated, including unit and regression tests, but also extending to tools such as linters, spell-checkers, and code autoformatters.

As a contributor to a software project, key points to keep in mind include:

  • Solve one problem at a time—the smaller and more self-contained a code review is, the more easily and effectively it can be reviewed.
  • Provide a thorough explanation of the reasons behind the proposed code change—both as code comments and as the “description” or “summary” attached to the code review request, which can and should include screenshots, example payloads, and so forth.
  • Provide testing to demonstrate that the change does what it sets out to do. (Ideally automated, but even a well-documented manual test is far better than nothing!)
  • Approach the code review as a learning experience, and take feedback with an open mind.

As a reviewer of a code review, you should:

  • Approach the code review as both a teaching experience (sharing your hard-won expertise with the current code) but also as a learning experience.
  • Provide feedback politely and without ego (no matter how tempting it may be to regard your own existing code as impossible to improve upon!).
  • Link to relevant documentation and best practices to clarify and support any feedback you provide.

What Should We Look For in a Code Review?

I like to think of different approaches to a code review as a series of distinct frames of mind, or “hats” that I might “wear”. You can also think of “wearing a hat” as assuming a different persona as a reviewer, then focusing on areas that are important to that persona. In practice, there are no firm dividing lines between these, and I’ll often “wear” many “hats” at once as I’m doing a code review, but it can be a useful checklist to keep in mind for thoroughness.

The hats that I’ll discuss here are:

  • Beginner
  • User
  • Developer
  • Tester
  • Attacker
  • Maintainer

Hat of the Beginner

This involves an approach often labeled as “beginner’s mind” in other contexts. Fundamentally, the goal is to approach the code without preconceptions or assumptions, being unafraid to ask questions and seek clarification. The key skill here is curiosity. For example, you might ask:

  • Is the code understandable and well-documented?
  • Does this code actually do what the function name, comments, docstring, and so forth imply that it should do?
  • What might happen if this conditional logic check evaluates as False rather than True?
  • What might happen if a user provides “weird” or “invalid” inputs?
  • All in all, does the code change “make sense”?

Hat of the User

When wearing this hat, you focus on the experience of the user of this software. This could be a human user, but could also be another piece of software that interacts with this project via an API of some sort. Example questions to ask as a user might include:

  • Is the UI or API sensible, predictable, usable?
  • Is the operation of the software appropriately observable (via logging, metrics, telemetry, and so forth)?
  • Does the proposed code change introduce breaking changes to the existing experience of the user?
  • Does the proposed code change follow the principle of least surprise?
  • Is the code change clearly and correctly documented at all appropriate levels?

Hat of the Developer

This hat is what many of us may think of first when we think of approaches to code review, and it absolutely is a useful and important one at that. This approach focuses heavily on the details of the code and implementation, asking questions like:

  • Can this code be understood and maintained by developers other than the original author?
  • Is it well-designed, useful, reusable, and appropriately abstracted and structured?
  • Does it avoid unnecessary complexity?
  • Does it avoid presenting multiple ways to achieve the same end result?
  • Is it DRY?
  • Does it include changes that aren’t actually needed at this time (YAGNI)?
  • Does it match the idioms and style of the existing code?
  • Is there a standard or “off the shelf” solution that could be used to solve this particular problem instead of writing new code?

Hat of the Tester

This hat is my personal favorite, as I started my career as a software tester. The tester’s goal is to think of what might go wrong, as well as what needs to go right. You might ask:

  • Does this change meet all appropriate requirements (explicitly stated as well as implicit ones)?
  • Is the logic correct, and is it testable to demonstrate correctness?
  • Are the provided tests correct, useful, and thorough?
  • Does the code expect (and appropriately handle) unexpected inputs, events, and data?

… there are two ways of constructing a software design: One way is to make it so simple that there are obviously no deficiencies, and the other way is to make it so complicated that there are no obvious deficiencies. – Sir Tony Hoare

Hat of the Attacker

This is another fun hat (or maybe I just like finding problems?). The attacker’s hat is closely related to the tester’s hat, but takes on a more devious frame of mind. Here you should ask questions like:

  • Does the code show adequate performance under usual (and unusual) conditions?
  • Can I make the code crash or throw an exception?
  • Can I make the code access something I shouldn’t be able to?
  • Can I make the software break, corrupt or delete data, or otherwise do the unexpected?

Hat of the Maintainer

This is the big-picture counterpart to the detail-focused developer’s hat. Here you should be asking questions like:

  • If certain issues or nitpicks keep coming up in review after review, is there something we should automate in the future?
  • Does the code change fit into the broader context of the project?
  • Are any new dependencies being added to the project? And if so, are they acceptable (actively maintained, appropriately licensed, and so forth)?

References and Further Reading

Many others have also written about the art and science of effective code reviews. Here are a few that I found particularly useful:


Conclusion

I hope that you have learned something new from this overview of code reviewing approaches and best practices. While many of us may take more pleasure from writing our own code than reviewing that of others, it’s always worth remembering that a code review represents both a learning and a teaching opportunity for everyone involved, and that ultimately, the goal of every code review is to help make a better software project. I urge you to make code reviews a priority!

-Glenn


ntc img
ntc img

Contact Us to Learn More

Share details about yourself & someone from our team will reach out to you ASAP!

Nautobot and Device Lifecycle – Software (Part 2)

Blog Detail

This is part 2 of an ongoing series about using Nautobot and Nautobot’s Lifecycle Management Application to help you with your device hardware/software planning. You can visit Hardware – (Part 1) if you haven’t or want to revisit that portion.

In this part we will dive into how Nautobot can help you with device lifecycle planning by looking at the software object in Nautobot. You will need to install the Lifecycle Management Application in order to create a relationship between the devices/device_type and the software objects in Nautobot. In part 3 I will dive deeper on how to use the application to populate hardware notices and software attributes.

Software Lifecycle

When considering what you should look for in lifecycle management of software you should do quite a bit of research. Some questions you might ask yourself are:

  1. Does the software have features that are needed for your network?
    • If you are running OSPF in your network does the software support that?
    • If you are want to run LACP on interfaces, does the software support that?
  2. What current version is this software on?
    • Are there many hotfixes or patches that have been done to the software?
    • What build is the software on?
    • Are there any upcoming patches/hotfixes to be released?
  3. What are the current security issues that have not been fixed?
    • Are there any security flaws in features/protocols that you have in your network such as BGP/BFD/LACP?
    • If there is a flaw in a protocol/feature and it’s not something you use currently, will you encounter it in the future?
    • Search for CVEs and bugs in the software.
  4. How old is the software?
    • You will most likely want to research software that has been out for at least one year so you can verify the security issues and bugs.
  5. What is the EoX data for the software?
    • What is the End of Support (EoS) date?
    • What is the End of Security Vulnerability Support date?
    • What is the End of Maintenance Releases date?
    • What is the End of Service Contract Renewal date?

The best process would be to talk with your vendor on what software is best for your network if you are able to.


Nautobot’s Software Homepage

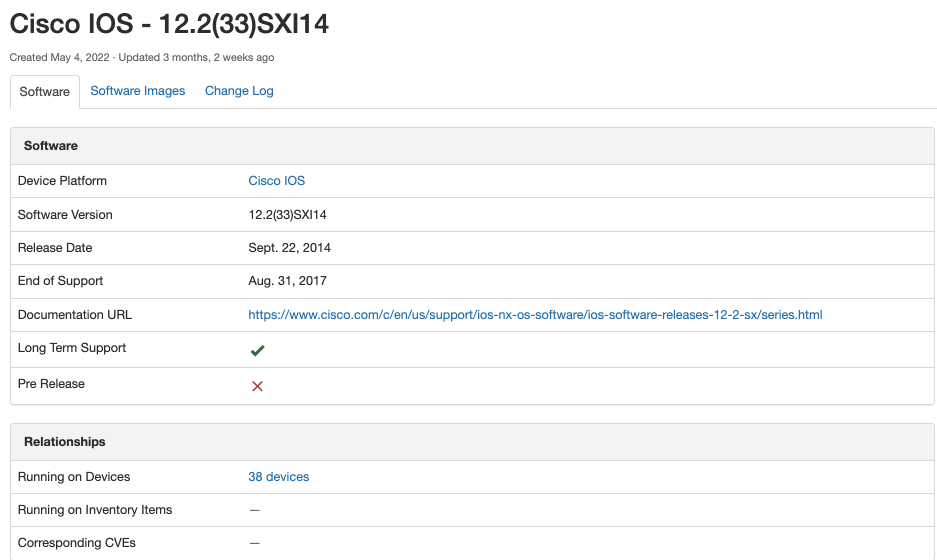
Here is an overview of what attributes a Nautobot software object can have:

Nautobot’s Software Homepage
  • Device Platform – This is usually the manufacturer/vendor of the software.
  • Software Version – Current software version number. This should be the current semantic version.
  • Release Date – Date that the software was released from the vendor.
  • End of Support – Date from the vendor when they will stop supporting the software with patches, fixes, etc.
  • Documentation URL – Documentation of the version provided by the vendor to help with security/hotfix/EoX announcements.
  • Long-Term Support – Will the software be in the network for some time?
  • PreRelease – Boolean if the software is currently in the prereleases stage so engineers know not to add to production devices.
  • Running on Devices – What devices in Nautobot are running the software?
  • Running on Inventory Items – What inventory items in Nautobot are running the software?
  • Corresponding CVEs – CVE that can be attached using the Device Lifecycle Management application.

The above attributes can be filtered by using Nautobot’s API or GraphQL queries. In part 3 I will discuss the plugin and have some examples of queries that can be used to filter out specific information that you could use to create a csv file or Excel file, for example.


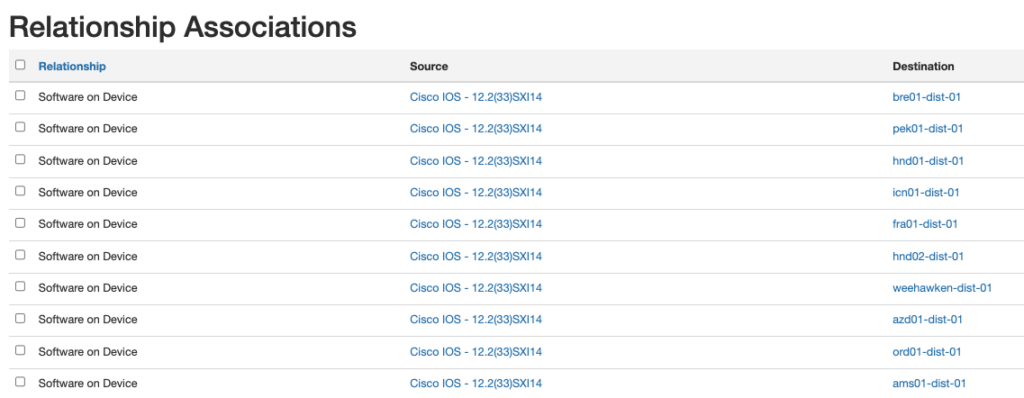
Nautobot Relationship Associations

As seen before in the software homepage, you can click on the “Running on devices” link to see what devices are running the software. In part 3 we will discuss further on how to build this relationship in the lifecycle application.

Nautobot Relationship Associations

Software Image Information

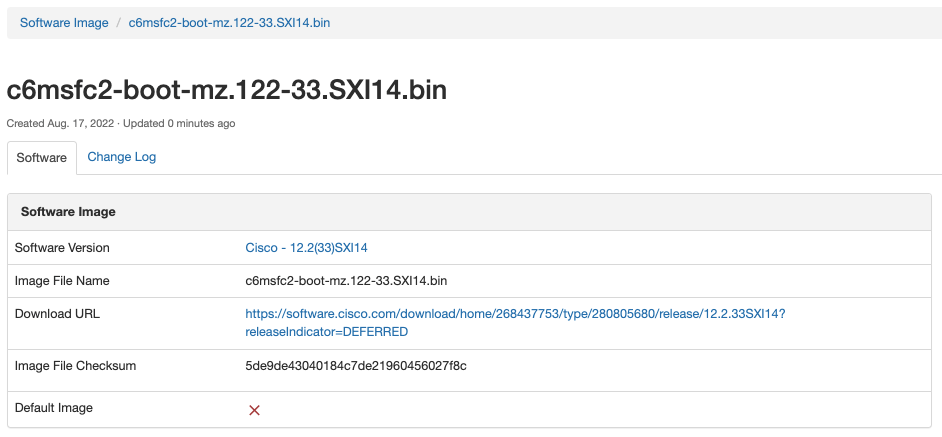
Looking at the software attributes screenshot, there is a tab for software image. You can assign different attributes to this Nautobot object, and you can see all the information pertaining to the software image when you click on this tab.

Software Image Information
  • Software Version – Current software version number. This should be the current semantic version.
  • Image Filename – The image filename of the software.
  • Download URL – URL or server path to follow to download the software. When onboarding new devices, this can come in handy for quick reference.
  • Image File Checksum – Checksum to validate once the software has been uploaded to the device to ensure it wasn’t corrupted during transfer.
  • Default Image – Boolean of whether the image is the default or not.
  • Assignments – Device, Inventory Items, and Object tags assignment.

What Can You Do with All This Information?

  1. Create a custom Nautobot job to pull software that is coming to End of Support in the next month and write that data to a csv/Excel file for review.
  2. Create a custom Nautobot job to query vendor’s website for updated information regarding the software and update Nautobot’s software object.
  3. Easily filter what devices are running what software to focus on upgrading devices.
  4. Create an Ansible playbook to query Nautobot’s API to find software that is about to expire. Then upload the future software to the device by polling the software’s filename, file path, and checksum.
  5. Create a GraphQL query for software with upcoming expiring date and use the results to craft an email to certain teams with a Nautobot job.

Conclusion

In the coming months I will be creating a specific blog post on each of the concepts mentioned below.

-Zack Tobar


ntc img
ntc img

Contact Us to Learn More

Share details about yourself & someone from our team will reach out to you ASAP!