Nautobot ChatOps for Grafana
Two of the more intriguing topics I have heard lately that also seems to resonates with network engineers and network professionals is the insight telemetry provides, and the ease of use chat platforms such as Slack and Microsoft Teams deliver to your keyboard and fingertips. The Grafana ChatOps application is designed to provide the best of both worlds. Grafana ChatOps is a Nautobot extension used with the Nautobot ChatOps base framework to provide all the operational graphs provided by Grafana delivered via chat clients.
Today, we will walk through some of the features within the Grafana ChatOps integration, as well as some of the requirements and procedures to get up and running with Grafana ChatOps.
An important note on the architecture design choices with this ChatOps app (plugin) is that chat commands are defined dynamically based on the Grafana panels and dashboards (we’ll go into this a little later). When you launch the app for the first time, you will see that no chat commands have been defined yet. You can define commands automatically or manually and tie them to specific Grafana panels within a dashboard.
Installation
The package for the Grafana ChatOps app is available on PyPI and can be installed using pip.
Prior to installing the Nautobot Grafana Plugin, you should have the following installed:
- Nautobot installed and configured.
- Grafana application installed and configured with dashboards and panels.
- Grafana Image Rendering Service installed.
- Grafana Image Rendering Plugin for Grafana installed in your Grafana application.
- Nautobot Plugin ChatOps installed and configured for your specific chat platform.
For the full installation guide, please refer to the Grafana ChatOps repo Install Guide.
Usage
Building Grafana ChatOps commands can be done using a manual or automated approach. The automated approach uses the DiffSync library to synchronize Grafana dashboards, panels, and variables with the Nautobot Grafana ChatOps plugin.
Defining Commands
To define a command within the Grafana plugin for use with your chat client, there are two main components that we need to have populated.
- Define at least one Grafana Dashboard.
- Define at least one Grafana Panel within the Dashboard.
This tutorial will take you through the steps noted above to get a chat command exposed in your chat client.
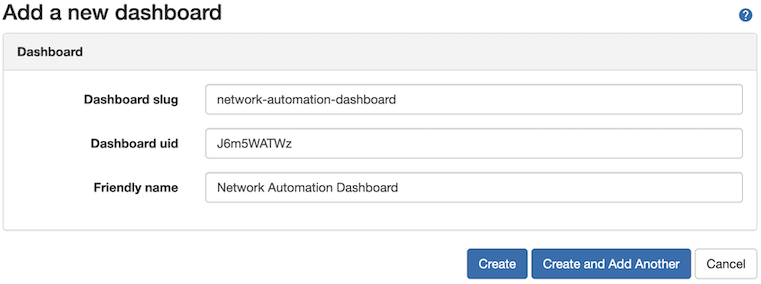
The first step is to define a dashboard so that the Grafana plugin is aware of the dashboard that exists within Grafana. You can define a dashboard in Grafana in two ways: defining a dashboard manually or using the “Sync” feature to synchronize your Grafana dashboards automatically.
Defining a Dashboard Manually
To define a dashboard manually, you can go to Plugins > Dashboards and click the + Add button located in the upper right of the screen. In the form for a new dashboard, you need to define the slug, uid, and Friendly Name.

NOTE: You can find the slug and uid info by navigating to your Grafana instance and going to the desired dashboard,
Defining a Dashboard Using the Sync Method
Alternatively, you can define a set of dashboards by synchronizing your Grafana dashboard configuration to the Grafana plugin. To synchronize dashboards, within Nautobot, navigate to Plugins > Dashboards and click the Sync button.
This process will utilize the DiffSync library to synchronize, create, update, and delete dashboards in Nautobot with the Dashboards that are defined in the Grafana application. Once complete, you will see all dashboards imported into Nautobot.
Defining Grafana Panels
The second step to defining Grafana commands in Nautobot for your chat client is to define the panels you wish to expose via chat.
Panels are closely associated to chat commands, where there will be a chat command for each panel defined.
Similar to dashboards, you can define panels in two ways within Nautobot.
Defining a Panel Manually
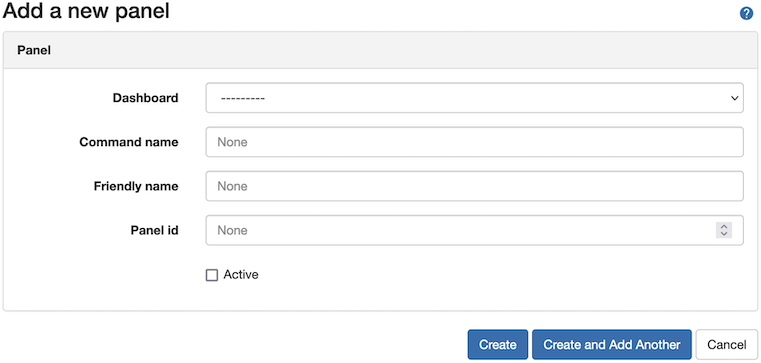
To define a panel manually, go to Plugins > Panels and click the + Add button located in the upper right of the screen. In the modal for a new panel, you need to select the dashboard that the panel is defined under, then add a command name, along with a friendly name, and define the Panel ID.
The Active checkbox will allow the command to show up in your chat client. If the panel is marked as inactive, it will still be defined in Nautobot, but restricted from being shown in the chat client.

NOTE: You can find the panel id by navigating to your desired panel, selecting
View, then looking at the URL.
Defining Panels Using the Sync Method
Alternatively, you can define a set of panels by synchronizing your Grafana panels configuration for a given dashboard to the Grafana plugin. To synchronize panels for a dashboard, within Nautobot, navigate to Plugins > Panels and click the Sync button.
This process will utilize the DiffSync library to synchronize, create, update, and delete panels in Nautobot with the Dashboard Panels that are defined in the Grafana application. Once complete, you will see all panels for a dashboard imported into Nautobot.
Panels are synchronized on a per-dashboard basis. All panels synchronized will be
INACTIVEby default, you will need to set them to active to see them in Chat.
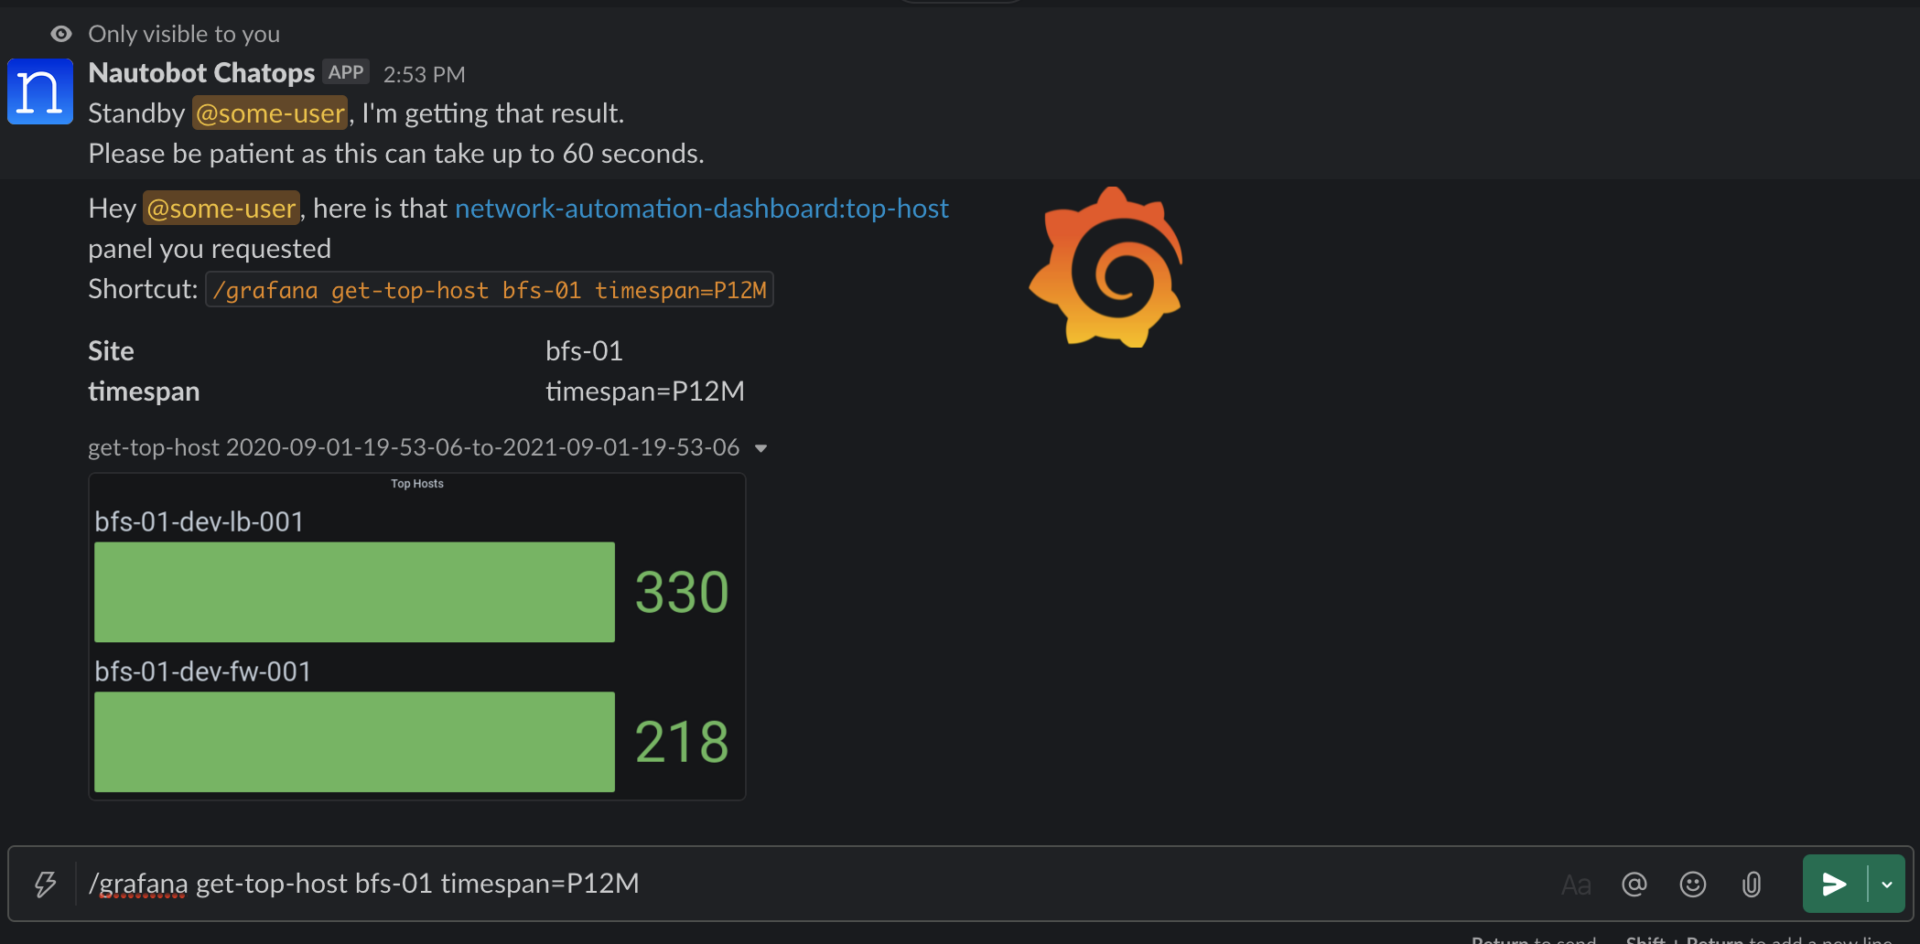
Once your dashboard and panels have been defined, and you activate the panels you wish to expose to the chat client, you will be able to see the available chat commands, as well as run commands to generate your panels.
Advanced Usage
Additional functionality can be added to the Grafana ChatOps plugin if you have variables defined on your dashboards. Panel variables can also be imported via the “Sync” functionality and associated with a panel. Then you can go in and customize how the variables behave and even enrich the ChatOps experience using Nautobot as a Source of Truth for your variables!
To read more on the advanced usage of the Grafana ChatOps plugin with panel variables, refer to the Advanced Usage Guide in the repository.
Conclusion
ChatOps has given a conduit to retrieve and respond interactively using a platform that is already in place and used for communication across almost any device, while Grafana has provided a feature-rich observability platform. With the Nautobot Grafana integration, we can now have the best of both worlds. Let us know how you’re using the Grafana ChatOps or if you have any questions or issues in the GitHub repo.
-Josh Silvas
Tags :
Contact Us to Learn More
Share details about yourself & someone from our team will reach out to you ASAP!


