Introducing Nautobot’s Floor Plan Application
Nautobot is the Source of Truth for your network and a platform that supports an application ecosystem. The most recent addition to the Nautobot Application Ecosystem is the Nautobot Floor Plan Application. Simply put, this application allows firms to map out and plan their physical space requirements, in a top-down view format, in locations such as data centers and colocation cages.
Benefits of Data Aggregation/Consolidation in the Floor Plan App
Having all your data that describes your desired network state in one place has a few advantages, including allowing users to expose relationships between different objects and easily access related data about a given object. These capabilities are not possible if the various data types are kept in disparate systems.
Nautobot can act as an aggregation layer across all the authoritative data sources in your environment.
The Nautobot Floor Plan Application itself has two tremendous benefits:
- It allows a firm to model, understand, and plan its floor space.
- It exposes relationships and allows easy navigation between the component racks and spaces in the floor plans and objects like the rack elevation drawing, device information, and site information.
This post will discuss and elaborate on these benefits.
Example Use Case Study
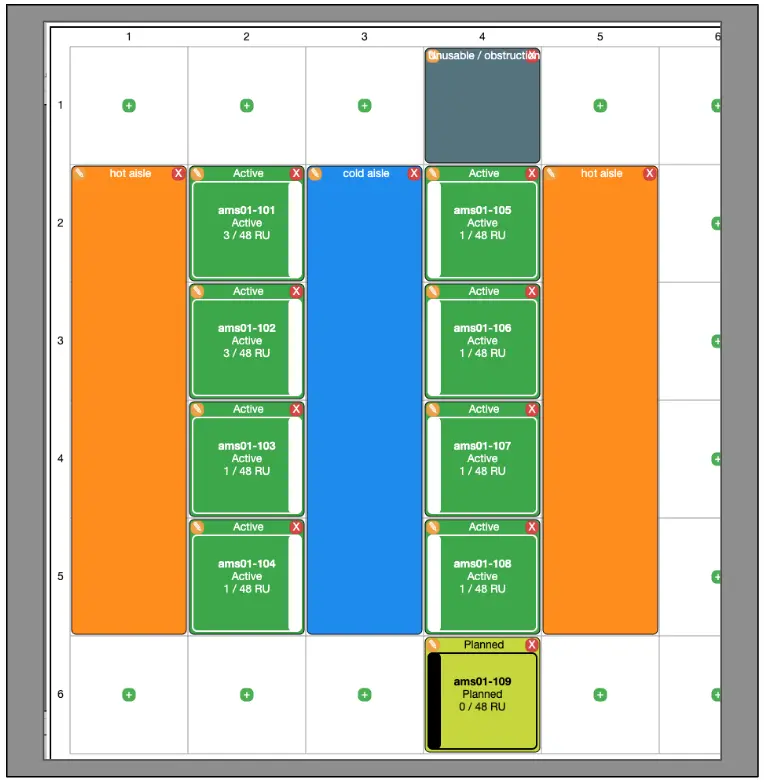
The Floor Plan Application aids in data center management by providing the ability to create a gridded representation of the floor plan of a Nautobot Location and indicate the relative location of each Nautobot Rack within that floor plan.
This example floor plan, below, created with the app, shows a lot of useful information:
- Two rows of racks (dark green) with the rack numbers and amount of rack units consumed (ex: 3 / 48 RU)
- A cold aisle (blue) between the two rack rows
- Hot aisles (orange) on the outside of each rack row
- Racks ams01-101 through ams01-104 face to the right (indicated by the white gap on each grid space)
- Racks ams01-105 through ams01-108 face to the left (indicated by the white gap on each grid space)
- An unusable space in grid 4, 1 (X, Y) (gray)
- A planned rack ams01-109 in space 4, 6 (light green) that will face left (indicated by the black gap on the grid space)
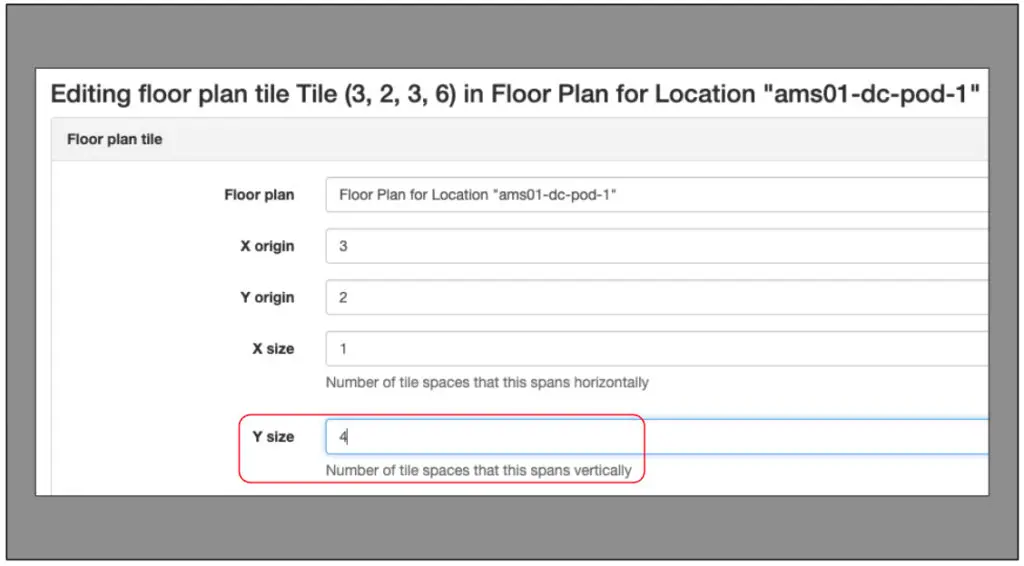
Also notice that the app allows users to create multi-tile objects. In the example floor plan, the cold aisle spans four tiles vertically, as described by the Y size parameter below:
Leveraging the Floor Plans in Nautobot
Having all the data for your desired network state in Nautobot makes it easier for us, as humans, to understand what is often a very complex environment. Let’s look at a scenario using our prior floor plan example.
In this scenario, the user has leveraged the Floor Plan App to model out the floor plan in the ams01 site and wants to better understand the equipment deployed in the ams01 racks shown.
Easy navigation in Nautobot from one object to related objects helps people understand what is typically a complex environment.
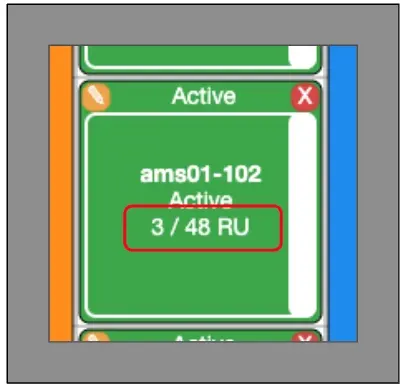
The layout shows that rack ams01-102 has 3 of the 48 available rack units occupied:
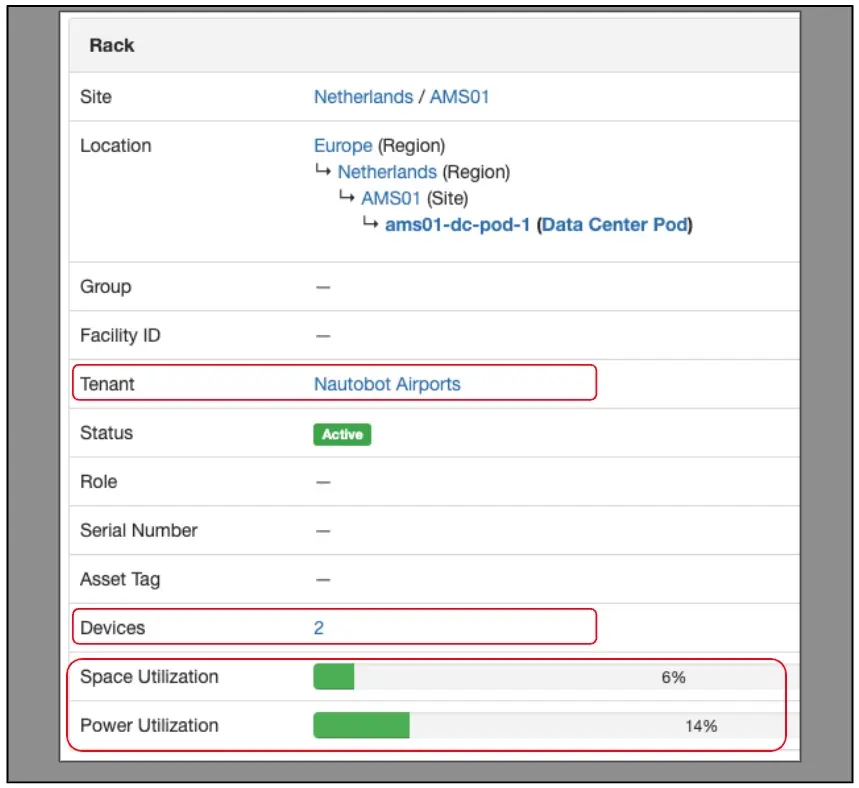
To further explore, the user can click in the middle of the ams01-102 grid square (representing a tile) to be taken to the rack’s home page in Nautobot. Once here, there is a wealth of useful information in the Rack panel:
- The quantity of devices in the rack
- The rack’s Tenant (owner)
- The space and power utilization in the rack
- To the right of the Rack panel there are rack elevation drawings for the front and back of the rack, displaying which rack units are occupied by which objects.
- Clicking on an object on the rack elevation drawing will take you to the home page for that object.
- The user sees that ams01-edge-02 is taking up rack units 40-41.

- The user clicks on the image of ams01-edge-02 in the elevation drawing to go to the home page for that device.
- The page shows details about the device, such as Device Type, Role, and management IP address.
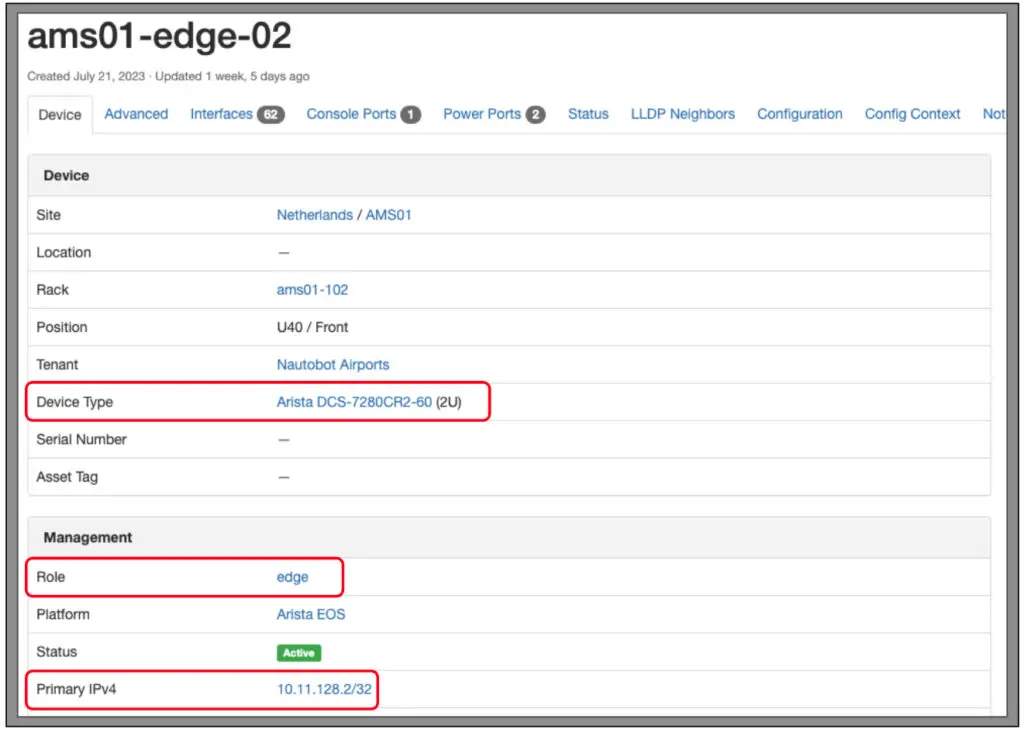
Easily navigating between these related objects saves users time and effort and helps to tie together the different aspects of, and data types involved in, activities such as space and power planning. This association of related objects can also simplify your automation infrastructure because it exposes the related fields and Custom Relationship via the GraphQL API. This allows you to construct a GraphQL query that is able to traverse both related fields and Custom Relationships to provide a more meaningful response.
Easily associating an object to other related objects in Nautobot also simplifies your automation infrastructure.
Creating and Editing the Floor Plans
The creation of floor plans is explained very well in the app’s documentation.
Why Is This Valuable?
The Floor Plan Application allows firms to effectively understand and plan their physical spaces in Nautobot because it not only models out the physical space, but also allows the users and automation to quickly navigate to other related data, such as power utilization in a given rack or a specific device model in a specific rack unit. Additionally, Nautobot’s automation features, such as robust RESTful APIs and GraphQL interface, allow for immersive programmatic integration with a firm’s automation infrastructure, allowing the firm to work toward fully automating space and power planning workflows, including running space and power reports for specific pods, rows, and racks.
Where to Find Nautobot’s Floor Plan Application
Code
The Nautobot Floor Plan Application code repository can be found on GitHub.
Docs
The documentation is here. This also includes installation instructions.
Want to Try It Out?
The Nautobot Floor Plan App is available to demo online in Network to Code’s Nautobot public sandbox environment. Once you log in (the user/password are shown in the blue banner when you access the URL), navigate from the top-level menu Organization –> Location Floor Plans. From here you can select a specific site and view the floor plan.
NOTE: To scroll your browser window so that the floor plan is fully in view, click and drag the scroll bar on the right side of your browser window. Using your scroll wheel when the cursor is over any part of the floor plan will zoom in or out rather than scrolling the window. Once you are zoomed in, you can click and drag to scroll.
From there you can do things like:
- Click on the ‘+’ or pencil icon on a square (tile) to edit a square’s attributes
- Add a specific rack in the square.
- Specify a status (reserved, hot aisle, code aisle, unusable, etc.) for the square.
- Specify a rack’s orientation in the square.

- Navigate to Organization –> Statuses to view, create, update, or delete statuses for use on the Floor Plans.

You can also join NTC’s public Slack channel and ask questions about the Floor Plan App in the #nautobot channel.
Wrapping Up
The Nautobot Floor Plan Application brings exciting and powerful capabilities to firms that:
- Want a convenient tool to manage their physical floor space
- Want a floor space planning tool that will integrate easily into an automated planning workflow; examples include:
- Automated space and power reports for a given pod, site, row, or rack
- Automated site floor layout planning Jobs
- Want to leverage Nautobot as a Source of Truth and understand that the more data Nautobot holds, the more value it provides
We are very excited to start talking with current and potential Nautobot users about this application; we hope that you are excited to try it out and that it delivers value to you and your firm!
Thank you, and have a great day!
-Tim
Tags :
Contact Us to Learn More
Share details about yourself & someone from our team will reach out to you ASAP!
