NetDevOps Concepts – Infrastructure as Code

Blog Detail

Welcome to the third in our series of posts about NetDevOps concepts! We have previously done an introductory post, as well as one on the concept of Minimum Viable Product, so be sure to check those out if you haven’t already!

In this post we’re going to dive into the concept of Infrastructure as Code or IaC, and how it can be applied to your network.

Infrastructure as Code is a commonly used DevOps term for managing or provisioning equipment in your infrastructure via an automated and repeatable process. This means that your infrastructure is always maintained in a known and pre-defined state, which allows you to utilize and enforce best practices across your entire infrastructure with ease.

In addition, adhering to Infrastructure as Code principles ensures that your infrastructure is less prone to unexpected or unplanned changes. Even if someone did change the infrastructure manually, and cause a negative impact, you are able easily and immediately re-apply the known/good state to restore service.

Your security team will thank you as well, because being able to uniformly ensure that good, secure, configurations are in place on your equipment makes their jobs tremendously easier.

The Pillars of Infrastructure as Code

In order to build an Infrastructure as Code based NetDevOps solution in your own network, it is essential to understand the key underlying components, or pillars, of Infrastructure as Code. A firm grasp on the pillars, how they interact, and which tools belong in which pillar, will allow you to craft a powerful and robust IaC solution in your environment.

Infrastructure as Code is usually built upon four key pillars.

  1. Source of Truth (SoT) – SoT is often a combination of the following components:
  2. CI/CD – CI/CD stands for Continuous Integration and Continuous Deployment or Delivery and describes systems used to manage and execute the changes to, or deployment of, your infrastructure.
  3. Tests – Tests allow you to go forward with the faith that changes executed by this process will be successful and not cause unwanted or unintended changes to your infrastructure.
  4. Deployment and Configuration Tools – These tools are varied and can take many forms depending on the IaC system being built. For NetDevOps these will frequently be tools or systems that can talk to the management plane of the network (via SSH or HTTPS) to implement changes.

If we were building the Infrastructure as Code “house”, consider Source of Truth to be the blueprints. The CI/CD system is the Foreman or General Contractor overseeing construction, and Tests are the Building Inspector. Your Deployment and Configuration Tools are the Electrician, Plumber, and Carpenter who build the house!

There are many potential combinations of Source of Truth, CI/CD, Testing and Deployment tools, so don’t worry if the possibilities initially seem overwhelming. For example, Source of Truth and CI/CD will have entire dedicated articles in this series. To assist with becoming more familiar with the tools available to you, at the end of this post we have collected an Appendix called “Lay of the Land” with tools in each of these pillars and links for further research.

An Example of the Pillars in Action

If we think about the IaC pillars, we can construct an example scenario using them to illustrate each pillar’s purpose in an overall Infrastructure as Code deployment.

A system built on these pillars often utilizes configuration and metadata files, kept in a Source Control system such as Git, to generate device configurations based on facts kept in a System of Record/DCIM such as NetBox. Together these elements form the Source of Truth for a portion of the infrastructure. Engineers would make changes to a file or files in Git to describe the desired changes to the state of the infrastructure. Prior to these changes being implemented on the infrastructure, they would require a peer review, and for any tests run by the CI/CD system to pass.

When these proposed changes are made to the relevant area of your Source of Truth, a CI/CD tool such as Jenkins will detect or be notified of the changes. The CI/CD tool will then execute a series of steps (often called a “pipeline”) to properly test these proposed changes to the infrastructure.

Inside the pipeline, tests are executed before any infrastructure changes are made, to validate their potential for success and any impact they may cause. Simple tests are commonly used to validate (or “lint”) that the changed files themselves are syntactically and logically valid. In addition, in a Network IaC pipeline, tests are often run with a tool such as Batfish which can analyze and understand network device configuration. These advanced tests allow you to validate potential changes will not affect an unexpected element of your network. They allow you to, in advance of touching the network itself, be confident that these changes will not cause adverse impact or unintended security policy changes. Pass or fail, the status of these tests are reported back to Git for display, or can be passed to a chat platform such as Slack.

If the tests are successful, and in this example the changes are approved and merged in Git, the changes are then able to implemented via a Deployment Tool, such as Terraform or Ansible (or both), or even plain Python. This step does not have to happen immediately, and the pipeline in your CI/CD tool can easily be made to wait until a pre-determined change window to execute the pending changes. Once the pipeline is ready to deploy the changes or infrastructure itself, the Deployment Tool will deploy or configure elements of your infrastructure based upon the changes recorded, approved, and tested, from the Source of Truth.

And finally, tests are executed once again to determine the success of the deployment actions. If these tests fail, they can either rollback the executed changes, or alert an engineer that some sort of intervention is needed via a message in Slack.

Network Infrastructure as Code

When speaking specifically about bringing Infrastructure as Code into the NetDevOps world, there are two common types of use cases.

The first type is utilizing IaC to deploy virtual network infrastructure itself. This would include for example, automatically provisioning an AWS VPC to terminate VPNs for your organization or spinning up a virtual firewall appliance in ESX.

The second type is utilizing IaC to deploy configurations to your existing network infrastructure (including physical equipment). This could be keeping the list of your BGP peers in a file in Source Control, and then applying the appropriate configuration to the routers in your network when changes are made to this file.

Determining which of these two areas you wish to work on first will be up to you, although most commonly in enterprise networks we see the later pursued (configuration of physical equipment) as it is the largest opportunity to have an impact on day-to-day operations. Removing the need to manually configure VLANs, and simply making a change to a file under Source Control with a CI/CD tool doing the rest, is extremely attractive to many organizations.

Infrastructure as Code and You

If you are feeling a little dazed and confused by all the ways that you can potentially bring Infrastructure as Code principles into your network, you’re not alone. There are many websites, blogs, or YouTube videos that can take you through the next steps on your NetDevOps journey. Or, you could always drop an email to us here at Network to Code as this is our bread and butter, and we’d be more than happy to help you take the next steps.

-Brett


Appendix: Lay of the Land

This is a listing (in no specific order) of commonly used tools in each of pillar to help you begin to organize them in your mind. It is worth noting two things about the below list. First, this is by no means exhaustive and intended simply to help you orient yourself among the plethora of tools that exist in each pillar. Wikipedia has long lists of common Source Control softwareopen-source configuration management tools, and other Infrastructure as Code Tools if you wish to dive deeper.

Secondly, some tools (such as Github or GitLab) appear in multiple pillars below as they provide multiple areas of functionality. This has happened more often in the past few years as, for example, closer integrations of Source Control and CI/CD have become standard features. Nothing is written in stone that says simply because you utilize GitHub for Source Control, you also have to utilize it for CI/CD. Evaluate each tool based on its strengths as well as you and your organization’s experience/familiarity with it.

Source of Truth

Given that a Source of Truth in practice is usually aggregated from several places, I’ve broken it out below into sections for Source Control and for Systems of Record. The relevant Systems of Record in an enterprise environment are often CMDB/DCIM (Configuration Management Database/Data Center Infrastructure Management) tools, so those are covered below.

Source Control

While Git is, by far, the most commonly used Source Control system (with many different services and implementations as shown below), it is good to understand some of the other Source Control tools available as well.

System of Record

Frequently in the System of Record category, there will be multiple of these inside a large organization. Not all elements of the network infrastructure are represented in each system, and some may be syncing data between themselves. In addition, while a CMDB or a DCIM serve different purposes in an environment, there is overlap in the data they may have, and thus can fill some of the same role in an Infrastructure as Code deployment. Some large enterprises have even built their own DCIM or CMDB tools in house, and integration with those tools will vary widely.

CI/CD

There is no clear winner in the CI/CD pillar, so we would recommend learning if one of the below is in existing use inside your organization and attempt to leverage it for your purposes.

Deployment and Configuration Tools

This pillar is very diverse, as the Deployment and Configuration tool you choose largely depends upon your use cases. It can be driven by what type of infrastructure you’re wishing to deploy/configure, how you wish to configure it, or even existing familiarity with a given tool.

It is worth calling out that there are a series of Python tools/libraries that are commonly utilized (frequently in combination) for building custom configuration tools for network equipment as well:

Testing Tools and Frameworks

Testing can take on many varieties and flavors, but for Network Infrastructure as Code the tools you use largely fall into three camps.

First are tools that lint/validate the configuration or code files themselves statically. That means tools which examine the contents of each file and insure, for example that the file claiming to be YAML formatted, really is valid YAML.

Second are tools that spin up infrastructure to allow you to test a simulacrum of your network. These tools, commonly used for training and educational opportunities, were traditionally the main way network changes were validated before the third category appeared.

Third, and the most exciting, are tools that validate the logic of the configuration changes you are attempting to make. These tools will actually analyze the change you are making and it’s potential impact to other elements of your infrastructure.


ntc img
ntc img

Contact Us to Learn More

Share details about yourself & someone from our team will reach out to you ASAP!

How to Build an ACL Auditor with Batfish

Blog Detail

One of the domains that I have worked in during my career is network security. And in this space, when it comes to firewalls, I’ve seen many problem areas such as:

  • Human error – ACL updates that have resulted in ACL entries being added incorrectly i.e wrong position within the list (think “deny any any” or “permit any any” at position 1!) resulting in either service outages or unintentional access into your network.
  • ACL clutter – Over time, ACLs are added to the rule base. However, when these rules are added, often they encompass other rule sets that are no longer required as they are never hit. Not only does this only present unnecessary clutter for anyone reading the ACL, but also requires greater cycles for the firewall to process.
  • Bad actors – Bad actors – an individual, group, or organization interested in attacking IT systems – that have managed to get into the firewall because of a vulnerability or another attack vector and open ports to allow them access into the network.

Based on these pain points I wanted to write an ACL auditing tool based on Batfish, that would automate the checks needed to prevent these issues from occurring, whilst also providing you with a springboard into the world of Batfish and network security automation.

Why Batfish? Batfish provides a great open source, vendor agnostic way to validate ACLs, as we will dive into later.

Note: To fully follow this guide you will need to have both Docker and Docker Compose installed.

Lets begin…

Batfish 101

What is Batfish?

Batfish is an open-source network configuration analysis tool that provides the ability to validate configuration data, query network adjacencies, verify firewall ACL rule sets and also analyze routing/flow paths.1

Batfish runs as a service, i.e a dockerized container. Snapshots of your network are then uploaded to the Batfish service. A snapshot is a collection of information that represents your network, such as device configurations, link/connectivity data and server details such as IP and IPtable settings. Therefore, Batfish requires no direct access to your network, and operates via a purely offline based model.

Batfish then ingests your network snapshot and builds a series of internal vendor agnostic models about your network. These models not only include configuration, but also control plane state such as BGP sessions etc. Questions are then issued to the Batfish service about your network via the Python SDK (pybatfish) or an Ansible Batfish role. Available question types include:

Furthermore, Batfish also supports the uploading of multiple snapshots from which you can then perform comparison against, as we will later. Below is an example of using pybatfish to check the session status of BGP.

>>> bfq.bgpSessionStatus(nodes="/spine|leaf/").answer().frame()
status: TERMINATEDNORMALLY
.... Wed Jun 26 15:01:16 2019 DST Begin job.
     Node      VRF Local_AS Local_Interface Local_IP Remote_AS Remote_Node Remote_Interface Remote_IP   Session_Type Established_Status
0   leaf1  default    64521            None  3.3.3.3     64520      spine1             None   1.1.1.1  EBGP_MULTIHOP        ESTABLISHED
1   leaf1  default    64521            None  3.3.3.3     64520      spine2             None   2.2.2.2  EBGP_MULTIHOP        ESTABLISHED
2   leaf2  default    64522            None  4.4.4.4     64520      spine1             None   1.1.1.1  EBGP_MULTIHOP        ESTABLISHED
3   leaf2  default    64522            None  4.4.4.4     64520      spine2             None   2.2.2.2  EBGP_MULTIHOP        ESTABLISHED
4  spine1  default    64520            None  1.1.1.1     64521       leaf1             None   3.3.3.3  EBGP_MULTIHOP        ESTABLISHED
5  spine1  default    64520            None  1.1.1.1     64522       leaf2             None   4.4.4.4  EBGP_MULTIHOP        ESTABLISHED
6  spine2  default    64520            None  2.2.2.2     64521       leaf1             None   3.3.3.3  EBGP_MULTIHOP        ESTABLISHED
7  spine2  default    64520            None  2.2.2.2     64522       leaf2             None   4.4.4.4  EBGP_MULTIHOP        ESTABLISHED

Installation

To install Batfish the following commands are run to pull down and then run our Batfish container image.2

docker pull batfish/allinone
docker run --name batfish -d -v batfish-data:/data -p 8888:8888 -p 9997:9997 -p 9996:9996 batfish/allinone

However, for this tutorial we can use a pre-built environment via docker-compose using the following commands.

git clone git@github.com:networktocode/ntc-soteria.git -b v0.1

cd ntc-soteria

docker-compose build
docker-compose up -d
docker-compose exec ntc-soteria bash

Once run, you will have 2 running containers (Batfish and ntc-soteria) and will be placed into the shell of the ntc-soteria container. This container will have pybatfish installed and access to the Batfish container.

We will be using ntc-soteria further when building our ACL auditor, and dive into this further later on in this guide.

Example

Let’s look at a small example. From the ntc-soteria repo previously cloned, we will use an example Cisco ASA configuration and run a question against our Batfish service.

Next, we fire up our Python interpreter, import the required pybatfish modules and create a snapshot from the ASA configuration contained within the ./data directory.

from pybatfish.client.commands import bf_session
from pybatfish.question import bfq
from pybatfish.question.question import load_questions
from acl_auditor.helpers import read_file

asa_config = read_file('data/asa.cfg')

bf_session.host = 'batfish'
load_questions()
bf_session.init_snapshot_from_text(asa_config, snapshot_name="base", overwrite=True)

We can now start asking questions about our snapshot. Below shows the ipOwners question to get the ip details of the device. Note: answer() runs the question and returns the answer in a JSON format. frame() wraps the answer as pandas dataframe. The Pandas Dataframe provides us with a data structure and various methods to parse, maniuplate and iterate the results.

>>> bfq.ipOwners().answer().frame()
status: TRYINGTOASSIGN
.... no task information
status: TERMINATEDNORMALLY
.... 2020-07-03 08:56:32.506000+01:00 Begin job.
  Node      VRF Interface              IP Mask Active
0  fw1  default   webfarm      10.0.1.254   24   True
1  fw1  default      mgmt  172.29.132.100   24  False
2  fw1  default    inside       10.0.0.13   30   True
3  fw1  default   outside   192.168.0.254   24   True

Note: answer() .frame()`.

As mentioned in the previous section, there are numerous questions available. This can also be seen by printing the names (questions) within the bfq namespace. Like so:

>>> from pprint import pprint
>>> pprint.pprint(dir(bfq))
['__builtins__',
 '__cached__',
 '__doc__',
 '__file__',
 '__loader__',
 '__name__',
 '__package__',
 '__spec__',
 'aaaAuthenticationLogin',
 'bgpEdges',
 'bgpPeerConfiguration',
 'bgpProcessConfiguration',
 'bgpSessionCompatibility',
 'bgpSessionStatus',
 'bidirectionalReachability',
 'bidirectionalTraceroute',
 'compareFilters',
 'definedStructures',
 'detectLoops',
 'differentialReachability',
 'edges',
 'eigrpEdges',
 'evpnL3VniProperties',
 'f5BigipVipConfiguration',
 'fileParseStatus',
 'filterLineReachability',
 'filterTable',
 'findMatchingFilterLines',
 'initIssues',
 'interfaceMtu',
 'interfaceProperties',
 'ipOwners',
 'ipsecEdges',
 'ipsecSessionStatus',
 'isisEdges',
...

From this list you will see 2 questions – filterLineReachability and compareFilters. These questions will form the basis of our ACL auditor.

Creating an ACL Auditor

We will now look at how to build an ACL auditor. We will be using the environment via the pre-built repo ntc-soteria https://github.com/networktocode/ntc-soteria, that used previoulsy to run a simple Batfish example.

Many of you may be asking, what’s the strange name ntc-soteria. Well,

in Greek mythology, Soteria was the goddess or spirit (daimon) of safety and salvation, deliverance, and preservation from harm.

ACL Auditor Overview

Our ACL auditor will be a CLI based tool, written in Python, powered by Batfish and will provide two types of audits:

  • Differential – Compares and reports the differences between a set of reference flows and a configured (implemented) ACL. Reference flows are 5-tuple policy definitions that define what should be permitted or denied by the firewall. By calculating and reporting the difference between the reference flows and implemented flows, we can ensure no unintended traffic is being permitted (or denied) by the firewall. This will be performed via the Batfish question compareFilters.
  • Unreachable Entries – Reports any entries within an ACL that will never be hit due to being shadowed by prior lines within the ACL. This will be performed via the Batfish question filterLineReachability.

Audit Types

Let’s look at each audit type in more detail.

Differential

This audit takes 3 pieces of information, a single YAML file containing a set of reference flows, the configuration of your firewall, and also the ACL name in question. It then compares your reference flows and implemented flows to provide you with a set of results showing the differences. The results include:

  • flows that your firewall IS permitting or denying but should not as they are not included in your reference flow definition.
  • flows that your firewall IS NOT permitting or denying but should as they are included in your reference flow definition.

Some use cases for this audit include:

  • Preventing human error during firewall changes. For example, incorrect addition of an “ip any any.”
  • Adding to the previous point, you can also add this to your ACL CI pipelines.
  • Allows you to run routine scripted checks against your ACL base to ensure no flows are opened incorrectly (for example by bad actors).

Unreachable

This check takes a firewall configuration containing your ACL rule sets. It then reports on any lines that will not match any packet, because of being shadowed by prior lines. The key use cases for this are:

  • Prevent human error during firewall changes. For example, incorrect placement of an encompassing deny rule.
  • Adding to the previous point, you can also add this to your ACL CI pipelines.
  • Assist in keeping your ACL rule sets minimal and free of unnecessary lines. This helps in clarity and also can reduce firewall overhead.

The Code

Code Layout/Files

From the shell you previously entered during the Batfish example earlier, you will now be presented with the following code structure for our tool.

tree .
.
├── Dockerfile                  // How to assemble the Docker image.
├── Makefile                    // Set of shell shortcuts. See avail via `make`. 
├── README.md                   // Details about repo.
├── acl_auditor                  
│   ├── __init__.py  
│   ├── auditor.py              // Main script file. 
│   ├── helpers.py              // Various helpers (file, acl generators).
│   ├── report.j2               // HTML report jinja2 template.
│   └── reporter.py             // Formats outputs, and renders outputs/report.
├── data
│   ├── asa.cfg                 // Example ASA configuration.
│   ├── csr.cfg                 // Example CSR configuration.
│   ├── flows.yml               // Example flow reference.
│   ├── report-example.png      // Example image of HTML report.
│   └── report.html             // Example HTML report.
├── docker-compose.yml          // Docker environment definition.
├── poetry.lock                 // Package management file for Poetry.
├── pyproject.toml              // Package management file for Poetry.
└── tests
    ├── __init__.py
    ├── test_config.cfg         // Test config for unit tests.
    ├── test_flows.yml          // Test flows for unit tests.
    └── unit
        ├── __init__.py
        └── test_helpers.py     // Unit tests

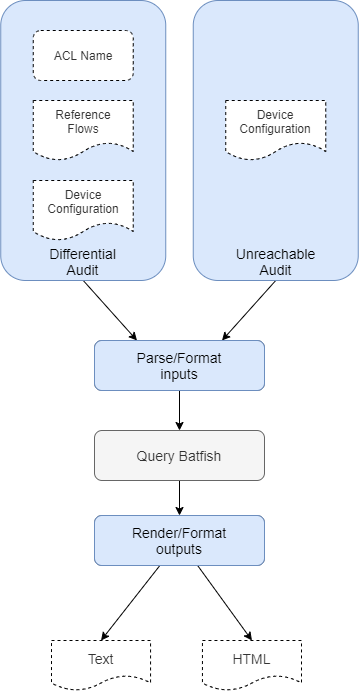
Based on the files above. At a high level we will:

  • Via the CLI, run the auditor.py module and pass in a set of inputs. Example inputs have been included within the data directory.
  • auditor.py contains a class ACLAuditor. This class contains various methods for performing the required Batfish actions.
  • Once the Batfish operations have been performed the results will be parsed and formatted via the reporter.py module, for output via the CLI and/or HTML.

A visual representation of this is below.

highlevel

Unreachable Entry Audit

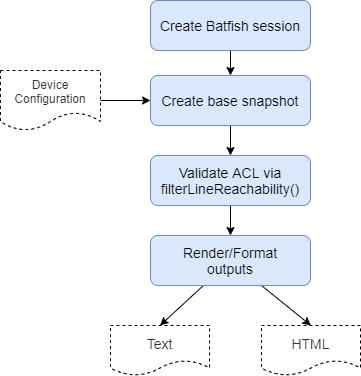
Let’s now look at how we build our unreachable audit. As mentioned previously this audit will report on any ACL entries that are shadowed by another ACL rule, and therefore would never be hit. To calculate this result we will use the Batfish question:

bfq.filterLineReachability().answer().frame()

Below shows an overview of the steps that we will perform within this audit.

differential
Build Batfish Session

As per our differential audit, the Batfish session will be created at the point of ACLAuditor instantiation. Like so:

./acl_auditor/auditor.py

...

class ACLAuditor:
    def __init__(self, config_file):
        bf_session.host = "batfish"
        load_questions()
        self.config_file = config_file

Create Snapshot

Next, we need to create a snapshot using our device configuration. We use the same method as we used before, as shown below:

./acl_auditor/auditor.py

...

def _create_base_snapshot(self):
    bf_session.init_snapshot_from_text(
        self.config_file, snapshot_name="base", overwrite=True
    )
Query Batfish

We now query Batfish via the bfq.filterLineReachability(), like so:

./acl_auditor/auditor.py

...
   def get_unreachable_lines(self):
        ...
        return bfq.filterLineReachability().answer()
Output Reports

Just like we did for our previous report we then pass our results into various reporting functions within reporter.py, which formats the outputs and also deals with the rendering of the HTML template using Jinja2.

Example

We will again use the example ASA configuration supplied. Within this configuration let’s focus in on the following ACL:

access-list acl-inside extended deny ip any4 any4
access-list acl-inside extended permit udp host 10.0.2.1 host 8.8.8.8 eq domain
access-list acl-inside extended permit udp host 10.0.2.1 host 8.8.4.4 eq domain

We run the audit, we get the following results:

./acl_auditor/auditor.py -c unreachable -d data/asa.cfg
+---------------------+-------------------------------------------------+---------------------------+-----------------------+----------------+
| Sources             | Unreachable Line                                | Unreachable Line Action   | Blocking Lines        | Reason         |
|---------------------+-------------------------------------------------+---------------------------+-----------------------+----------------+
| ['fw1: acl-inside'] | permit udp host 10.0.2.1 host 8.8.4.4 eq domain | PERMIT                    | ['deny ip any4 any4'] | BLOCKING_LINES |
| ['fw1: acl-inside'] | permit udp host 10.0.2.1 host 8.8.8.8 eq domain | PERMIT                    | ['deny ip any4 any4'] | BLOCKING_LINES |
+---------------------+-------------------------------------------------+---------------------------+-----------------------+----------------+

Here we can see that the line deny ip any4 any4 is blocking the 2 lines for DNS access out to Google. Great!

Differential Audit

So how do we use Batfish to perform a differential audit? That is, how do we compare and report on the differences between a set of reference flows and an ACL. In short we use the Batfish question bfq.compareFilters(). The questions takes a node name, along with 2 snapshots, containing your ACLs, and then returns the differences.

bfq.compareFilters(nodes='rtr-with-acl').answer(snapshot='filters-change',reference_snapshot='filters').frame()

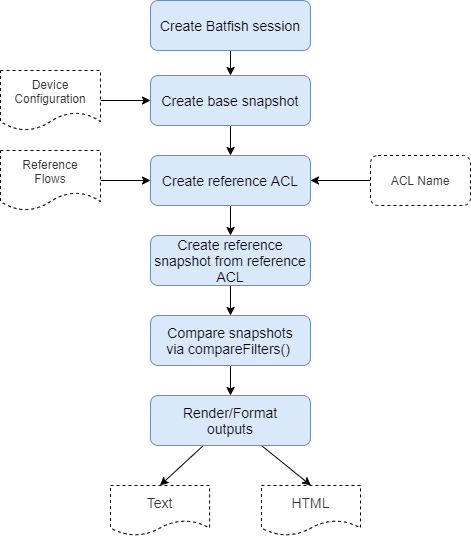
Unlike the previous audit this one is a little more advanced. Below shows the steps involved. To summarize we will:

  1. Create a snapshot from our device configuration.
  2. Convert our YAML reference flows into an ACL.
  3. Create a reference snapshot using the reference ACL.
  4. Compare the 2 snapshots.
  5. Return the results.
compare

Let’s step through the key steps and code:

Build Batfish Session

Our Batfish session will be built within the constructor of the ACLAuditor class. Like so:

./acl_auditor/auditor.py

class ACLAuditor:
    def __init__(self, config_file):
        bf_session.host = "batfish"
        load_questions()
        self.config_file = config_file
...
Convert Reference Flows

First we take a set of reference flows, that we have defined as YAML (as shown below), and convert them into an ACL based format.

./data/flows.yml

---
- source_ip: 10.0.1.1/32
  dest_ip: 8.8.8.8/32
  dest_port: 53
  proto: udp
  action: permit
- source_ip: 10.0.1.1/32
  dest_ip: 10.200.1.1/32
  dest_port: 3306
  proto: tcp
  action: permit

For this we use YAML to ACL convertor helper functions found within helpers.pygenerate_acl_syntax_juniper_srx().

Create Snapshots

We now have our reference flows in an ACL based format. We will use this ACL to generate a reference snapshot. We will then use our device config to generate a base snapshot.

Like so:

...    
    def _create_base_snapshot(self):
        bf_session.init_snapshot_from_text(
            self.config_file, snapshot_name="base", overwrite=True
        )

    def _create_reference_snapshot(self, hostname):
        platform = "juniper_srx"
        reference_acl = create_acl_from_yaml(
            self.flows_file, hostname, self.acl_name, platform
        )
        bf_session.init_snapshot_from_text(
            reference_acl,
            platform=platform,
            snapshot_name="reference",
            overwrite=True,
        )
        self.validate_reference_snapshot()  
Query Batfish

With the 2 snapshots created, we can run our bfq.compareFilters() question, as shown below.

def get_acl_differences(self, flows_file, acl_name):
...
    return bfq.compareFilters().answer(
        snapshot="base", reference_snapshot="reference"
    )
Output Reports

Once done we then pass our results into various reporting functions within reporter.py, which formats the outputs and also deals with the rendering of the HTML template using jinja2.

Example

Let’s take our reference flows, which are shown below. These are the flows that should be configured; nothing more, nothing less.

---
- source_ip: 10.0.1.1/32
  dest_ip: 8.8.8.8/32
  dest_port: 53
  proto: udp
  action: permit
- source_ip: 10.0.1.1/32
  dest_ip: 10.200.1.1/32
  dest_port: 3306
  proto: tcp
  action: permit

In this case, we will use an ASA configuration as our device config. Below shows the ACL in question:

access-list acl-webfarm extended permit tcp any host 10.0.2.1 eq 3306
access-list acl-webfarm extended permit udp host 10.0.1.1 host 8.8.8.8 eq domain
access-list acl-webfarm extended permit udp host 10.0.1.1 host 8.8.4.4 eq domain
access-list acl-webfarm extended deny ip any4 any4

When we run the audit we get the following results:

+------------------------+---------------------------------------------------------+---------------------------+-------------------------------------------------+
| Reference Flow Index   | Reference Flow Content                                  | Implemented Flow Action   | Implemented Flow Content                        |
|------------------------+---------------------------------------------------------+---------------------------+-------------------------------------------------+
| 1                      | "flow2 (10.0.1.1/32 any 10.200.1.1/32 3306 tcp permit)" | DENY                      | deny ip any4 any4                               |
| No Match               |                                                         | PERMIT                    | permit tcp any host 10.0.2.1 eq 3306            |
| No Match               |                                                         | PERMIT                    | permit udp host 10.0.1.1 host 8.8.4.4 eq domain |
+------------------------+---------------------------------------------------------+---------------------------+-------------------------------------------------+

So we have 3 differences (failures) that the audit has returned. Lets step through each one by line:

  1. The reference flow 10.0.1.1/32 any 10.200.1.1/32 3306 tcp permit is not permitted due to the implemented line deny ip any4 any4.
  2. The implemented ACL is permitting permit tcp any host 10.0.2.1 eq 3306. However, no match for this flow is found within the reference flows.
  3. Likewise, the implemented ACL is permitting permit udp host 10.0.1.1 host 8.8.4.4 eq domain. However, No Match for this flow is found within the reference flows.

Great, we have detected flows that should have been implemented and also flows that were incorrectly implemented.

HTML Report

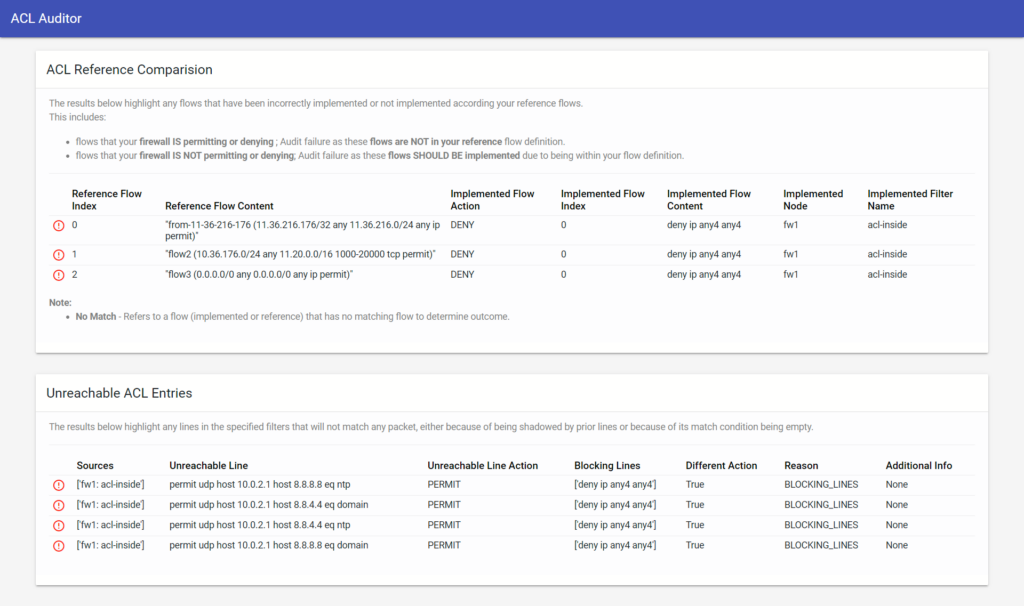
We previously ran the audits individually out to just the CLI. However, I’ve also included the option to output the results as an HTML template, as shown below:

html-report

This report is generated via an additional -o html option when running both audits. For example:

./acl_auditor/auditor.py -c all -d data/asa.cfg -r data/flows.yml -a acl-inside -o html

A detailed dive into how the template is constructed and rendered is outside the scope of this article. But the key points are:

Thanks

A thanks goes out to Ratul Mahajan and Dan Halperin at Intentionet for their help and input into this tool.

References

  1. “A Hands-on Guide to Multi-Tiered Firewall … – PacketFlow.” 13 Dec. 2019, https://www.packetflow.co.uk/a-hands-on-guide-to-multi-tiered-firewall-changes-with-ansible-and-batfish-part-1/. Accessed 23 Jun. 2020. 
  2. “A Hands-on Guide to Multi-Tiered Firewall … – PacketFlow.” 13 Dec. 2019, https://www.packetflow.co.uk/a-hands-on-guide-to-multi-tiered-firewall-changes-with-ansible-and-batfish-part-1/. Accessed 24 Jun. 2020. 

Conclusion

I hope you have enjoyed reading this article as much as I have enjoyed writing it. When it comes to Batfish, I have only really scratched the surface in what you can perform when it comes to flow validation. For example, this audit could be extended to check flows across multiple devices (think dual layer firewall topologies).

I hope this has provided you with a springboard into the world of Batfish, and network security based automation.

Thanks for reading.

-Rick Donato (@rickjdon)


ntc img
ntc img

Contact Us to Learn More

Share details about yourself & someone from our team will reach out to you ASAP!

How to Build a Webex Teams Chatbot

Blog Detail

By now I’m sure most of you would have heard the terms ChatOps and Chatbots.

For many of you these terms may be new, and if not you may be wondering how to get started. In this article, we will answer these questions and also get hands-on with building a Chatbot within the collaboration platform Webex Teams.

ChatOps, a term originally coined by the folks at Github, is all about conversation-driven operations.1 This is achieved via a Chatbot that is integrated with your chat platform (such as Webex Teams, Microsoft Teams or Slack) and configured to execute various actions upon commands or actions submitted by the user.

By bringing your tools into your conversations and using a Chatbot modified to work with key plugins and scripts, teams can automate tasks, collaborate more, and to work faster and more efficiently.2

When it comes to Chatbots, there are two main types – text-based and menu/button-based:

  • Text-based – Bots are created to accept a text command, execute a command and then return the result back to the user. For the scope of this article, this is the type of Chatbot we will be building.
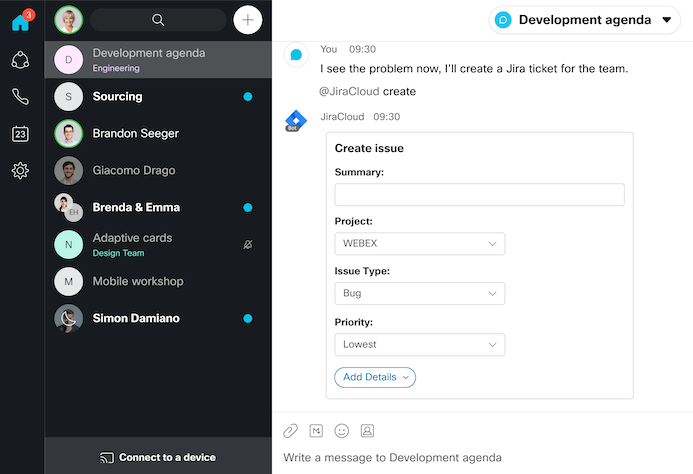
  • Menu/button-based – The latest Chatbots now provide dialog inputs and other interactive elements as opposed to text commands.3 With Webex Teams, this type of Chatbot is built with Buttons and Cards (example below), based upon the Microsoft Adaptive Cards specification. Microsoft Teams also utilizes Adaptive Cards, whereas Slack provides Block Kit.
webex-adaptivecards

Image source: https://developer.webex.com/docs/api/guides/cards

Pull vs Webhooks

There are 2 main methods for getting the data and/or actions from the user to the Chatbot for processing – pull and webhooks.

  • Pull – The Chatbot continuously pulls data from the chat platform, for example, messages. An example of a pull-based bot can be found in this previous post on building a basic Slack bot with Python – https://networktocode.com/blog/Basic-Slack-use-with-Python/.
  • Webhooks – Instead of polling the chat platform, a webhook is only sent to the bot in the event of a given condition, for example, a new message is created, or a form submission. This method prevents continuous polling and therefore can reduce the resource overhead to both the chat API endpoints and Chatbot.

Chatbot Demo Overview

At a very high level, our user will enter an IP address and netmask within the Webex Teams client (be it the mobile app, web browser, or desktop app). Our Chatbot will then perform an ipcalc against the IP and subnet, then return the result to the user.

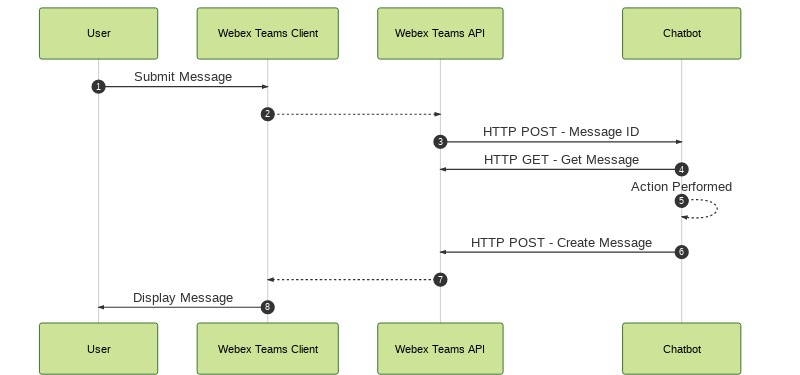
Workflow

Let’s step through the order of operations for our Chatbot.

  1. The user submits a message within Webex Teams.
  2. Webex Teams then processes this submission.
  3. This submission triggers a webhook, an HTTP POST to our Chatbot endpoint, containing a message ID.
  4. The Chatbot will then issue an API call out to the Webex Teams API to collect the message details using the previous message ID.
  5. Using the message details, our Chatbot will then perform the required action. In our case taking the IP/Subnet and running ipcalc.
  6. A message is then created containing the results of ipcalc.
  7. The message is displayed to the user via the Webex Teams client.
workflow

Webex Teams Configuration

To begin, we perform the required configuration within Webex teams. This consists of creating our bot, adding our bot to our Webex Teams space, along with creating a message webhook.

Create Bot

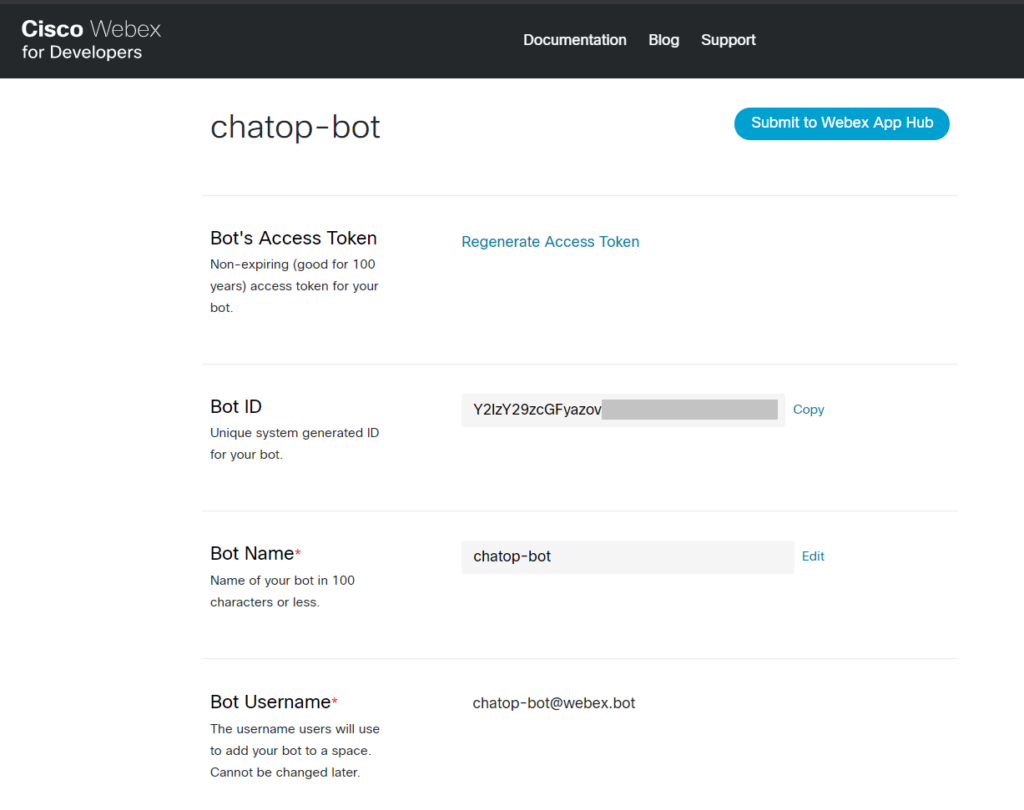
First of all, we need to create our bot. This is done on the Webex platform via the URL https://developer.webex.com/my-apps.

Once created, you will be provided with two important pieces of information, the Bot Access Token and the Bot ID which we will use in later steps.

create-bot

Note: If you do not have a Webex Teams account, you can register for a free trial over at https://www.webex.com/team-collaboration.html.

Add Bot to Space

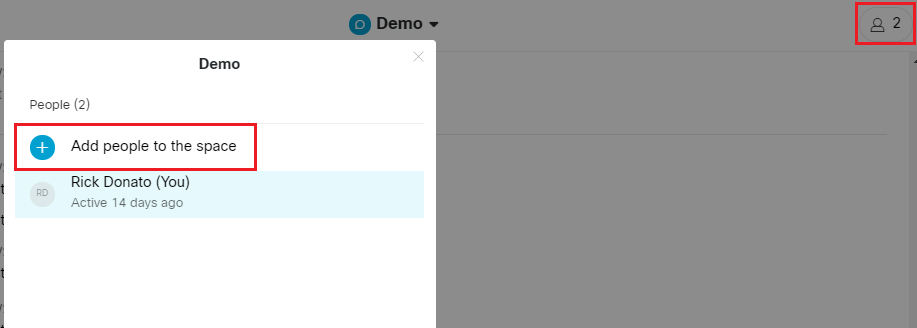
Next, add your new bot within your Webex Teams space. Like so,

add-bot-room

Create Webhook

We will now turn our attention to creating our webhook. Webex Team webhooks are created via its REST API. There are many ways to send an API request, such as curl or via the Python requests module. However, we will use Postman.

Postman is an API (application programming interface) development tool that helps to build, test, and modify APIs.4

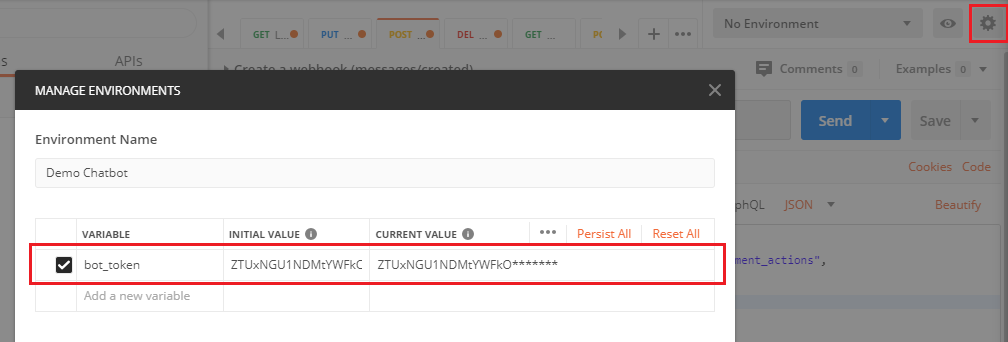
The benefit of using Postman in this scenario is that we can utilize the prebuilt Webex collection, located at https://github.com/CiscoDevNet/postman-webex. This will save you time, and also give you a bunch of other API requests should you want to explore further. Once you have imported the collection into Postman you will need to assign the previously obtained Bot Access Token as the variable bot_token, within a Postman environment (as shown below). The main benefit of doing this is that it will prevent us from needing to add our Bot Access Token to each API call we make.

postman-environment

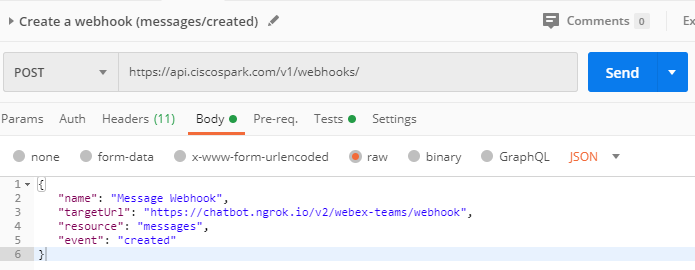
We can now create our webhook by locating the Create a webhook (messages/created) request inside the Webex Teams API v1 collection. Within the body add the details as shown below. To summarize the body shown, it specifies that when a message is created send a webhook to the targetUrl. Once created, click send.

create-webhook

Building the Chatbot

With Webex configured, let’s create our bot! To provide an API endpoint that the Webex Teams API can send the webhook to, we will build our Chatbot using the web framework Flask.

Clone Repo

First clone the repo, as shown below:

git clone git@github.com:networktocode/chatbot-demo.git

Create Virtual Environment

Next, create a virtual environment. We then activate (enter) the virtual environment and install our Python dependencies that our bot will require.

cd chatbot-demo
virtualenv --python=/usr/bin/python3 venv
source venv/bin/activate
pip install -r requirements.txt

Create Environment Variable File

We will define all of our environment variables that our bot will require within .env. To create this file, run the command cp .env-example .env and then add the Bot access token and username obtained previously. An example of .env-example is shown below.

WEBEX_TEAMS_ACCESS_TOKEN="########"
WEBEX_BOT_USERNAME="########"
NGROK_TOKEN="########"

Setup Ngrok

Ngrok is a reverse proxy that creates a secure tunnel from a public endpoint to a locally running web service. ngrok captures and analyzes all traffic over the tunnel for later inspection and replay. 5

In other words, Ngrok allows us to create a public endpoint that Webex Teams can send the webhook to. This Ngrok public endpoint will then send the API call (webhook) over a secure tunnel to the localhost that is running our bot.

Note: This setup is only required for development purposes. Typically within a production based setup, the bot endpoint would be exposed publicly.

To download Ngrok go to https://dashboard.ngrok.com/get-started/setup. Once complete you will be provided with a Ngrok authentication token, which you will need to add to .env.

You can now run Ngrok via the following commands.

export $(cat .env | xargs)
/opt/ngrok authtoken ${NGROK_TOKEN_ENV}
/opt/ngrok http -subdomain=chatbot 5030

Note: The above is based upon you installing Ngrok within the /opt folder.

Install System Dependencies

Our bot will be using ipcalc to perform the subnetting calculations, therefore we will need to install it like so:

apt-get install ipcalc

Execute Chatbot

Before we execute our bot, there are a few things worth mentioning about the code.

  • A single Flask view is created to respond to HTTP POST requests against “webex-teams/webhook`.
  • The Webex Teams SDK is used to simplify the process of performing the necessary API requests (steps 4 and 6 in the previous workflow diagram).
  • The line condition if request.json["data"]["personEmail"] == os.getenv("WEBEX_BOT_USERNAME") ensures that our bot does not process messages originating from itself. This is a loop prevention mechanism. `

Let’s now execute our bot. Like so,

python chatbot/webex_teams_bot.py

Test Bot

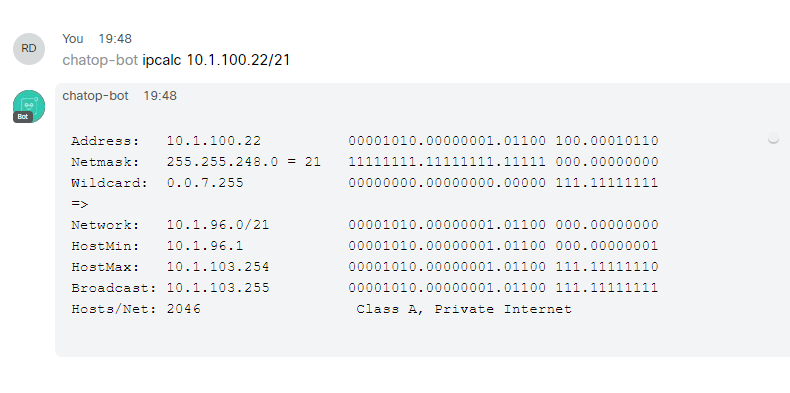
To test your new bot go into your Webex Teams space then mention your bot, followed by ipcalc and then the subnet address. Like so: @<your_bot_name> ipcalc <x.x.x.x>/cidr. Below shows an example:

test-bot

References

  1. “ChatOps 2.0 — What, How and Why? – YellowAnt.” https://blog.yellowant.com/chatops-2-0-what-how-and-why-9bbd408f21dd. Accessed 18 May. 2020. 
  2. “What is ChatOps? And How do I Get Started? – PagerDuty.” 2 Dec. 2014, https://www.pagerduty.com/blog/what-is-chatops/. Accessed 18 May. 2020. 
  3. “ChatOps 2.0 — What, How and Why? – YellowAnt.” 19 Mar. 2018, https://blog.yellowant.com/chatops-2-0-what-how-and-why-9bbd408f21dd. Accessed 26 May. 2020. 
  4. “Introduction to Postman for API Development – GeeksforGeeks.” https://www.geeksforgeeks.org/introduction-postman-api-development/. Accessed 19 May. 2020. 
  5. “inconshreveable/ngrok: Introspected ….” https://github.com/inconshreveable/ngrok. Accessed 19 May. 2020. 

Conclusion

Well, there we have it folks. It’s been a blast and I would like to thank you for reading. Stay tuned for future posts around the world of Chatbots.

-Rick Donato (@rickjdon)


ntc img
ntc img

Contact Us to Learn More

Share details about yourself & someone from our team will reach out to you ASAP!