Palo Alto Panorama ChatOps with Nautobot

Blog Detail

Here at Network to Code, we are continually developing new ChatOps integrations for the underlying Nautobot ChatOps Framework. We have recently released a new ChatOps integration for Palo Alto Panorama systems. This ChatOps application is used to interact with the Palo Alto Panorama system and comes prepackaged with various chat commands. You can now get specific information or run advanced ACL checks on Panorama using your existing ChatOps service including Slack, Team, Webex, and Mattermost.

For installation steps, refer to its README. To install the underlying Nautobot ChatOps framework, refer to the documentation found here.

Commands

The Nautobot ChatOps Panorama app extends the capabilities of the Nautobot ChatOps framework adding a new chat command: /panorama. As of version 1.1.0, (the current version as of this writing), there are seven commands available to use. They are:

  • capture-traffic
  • export-device-rules
  • get-device-rules
  • get-version
  • install-software
  • upload-software
  • validate-rule-exists
Commands

Capture Traffic

The capture-traffic subcommand will prompt the user to choose the interesting traffic that needs to be captured and the device name and interface to run the capture on. It will then gather the necessary information from Panorama and run the capture directly on the firewall. Then it will export the packet capture directly to the user via the ChatOps client as a .pcap file capable of being opened in Wireshark.

This is by far my favorite command available, as I’ve spent way too long trying to set up packet captures on firewalls over the years! One caveat to this command is that in order to use it Nautobot requires access to both Panorama and the management IP address of the Palo Alto device it’s running a capture on.

Export Device Rules

The export-device-rules subcommand will prompt the user to select a Palo Alto firewall, then generate a list of firewall rules on it and output it in chat in a CSV format.

Get Device Rules

The get-device-rules subcommand is similar to the previous command, in that it will prompt the user to select a Palo Alto firewall, then generate a list of firewall rules on it and output them to the chat client in an easy-to-read format.

Get Version

The get-version subcommand is one of the simplest commands available. It will simply return the current version of the Panorama system configured. It does not require any additional input or device selection.

Install Software

The install-software subcommand allows you to install a new OS version on a Palo Alto firewall that has been previously uploaded to it. As with any commands that make changes to a device, we recommend testing this on a lab or other non-production system first!

Upload Software

The upload-software subcommand allows you to upload a specific PanOS version to a Palo Alto firewall. This can be used prior to running the install-software command mentioned above.

Validate Rule Exists

The validate-rule-exists subcommand is another one of my favorites. It prompts the user to select a firewall device, as well as source and destination traffic information to check. It will then check the firewall rules to see whether there is a matching rule for this traffic. If found, it will return the results to the user. This can be very handy to quickly see whether a new rule being requested is already in place, helping prevent duplicate rule creations


Conclusion

These commands handle only a subset of the information that can be gathered by the Panorama chatbot. You can contribute more commands with minimal Python code! Because the Nautobot ChatOps plugin lowers the barrier of entry by already handling the interaction between Nautobot and chat applications like Mattermost, Microsoft Teams, Slack, and Webex, creating new commands is extremely easy. We encourage you to create your own commands by building on top of existing commands and plugins that we at NTC have created—or even create your own command to interact with something you use on a daily basis.

We also encourage, in the GitHub repo for the app, any feedback, feature requests, or reports of bugs you may find.

-Matt


ntc img
ntc img

Contact Us to Learn More

Share details about yourself & someone from our team will reach out to you ASAP!

Working with Webhooks in Nautobot

Blog Detail

This week’s Nautobot blog deals with webhooks. In basic terms, a webhook is a method for one web application to programmatically provide information to another web app.

The use case for webhooks is predicated on events: when a certain event happens, another event should happen in response. If that response is an action by a different app, then a webhook can be sent to notify the app that it needs to take action. The webhook can also carry information to that receiving app, including:

  • Notification that a specific event happened
  • Information about the event

Let’s illustrate this with a practical use case. This post will describe how to create a webhook in Nautobot that will trigger when a new device is created. The webhook will notify Microsoft Teams to post a message about the event in a channel.

Getting a Target URL (MS Teams Example)

A webhook needs a target URL: this is a destination endpoint for the webhook to send its information to.

This example will use MS Teams, but most of the chat platforms have easy methods for creating incoming webhook endpoints.

It’s quite simple to get an incoming webhook URL for MS Teams:

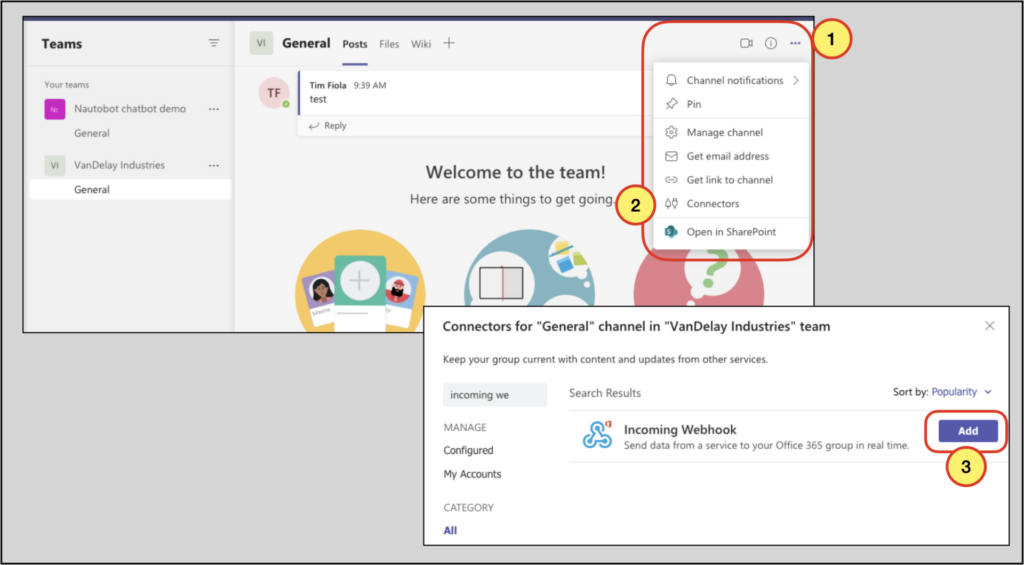
1. In the desired Teams channel, click on the three dots (…) in the top-right corner of the channel.

2. Click on Connectors.

3. Search for incoming webhooks and then click on Add; this action allows you to set webhooks on the channel.

teams-setup

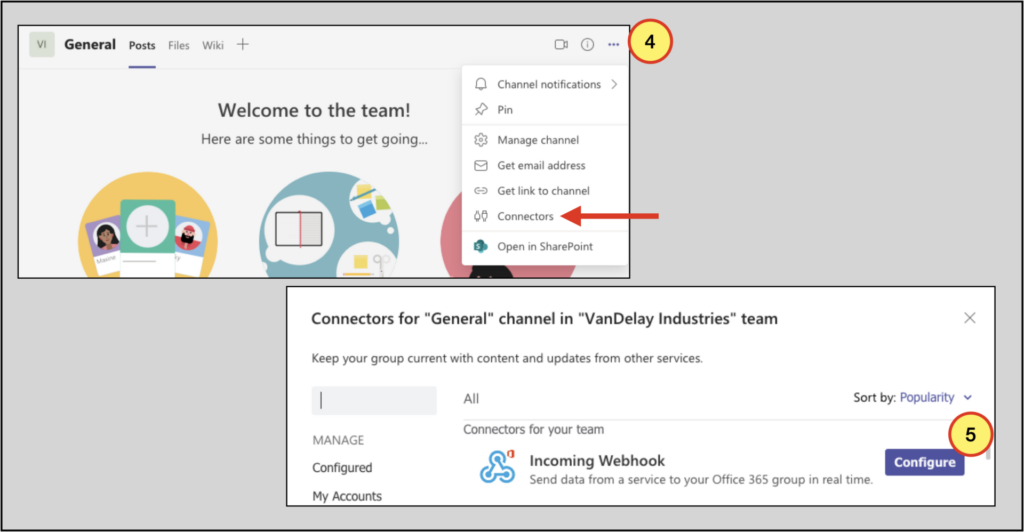
4. To create the webhook, go back to the three dots (…) in the top right of the channel and click on Connectors.

5. You will see Incoming Webhook listed as a connector; click on Configure.

teams-setup-2

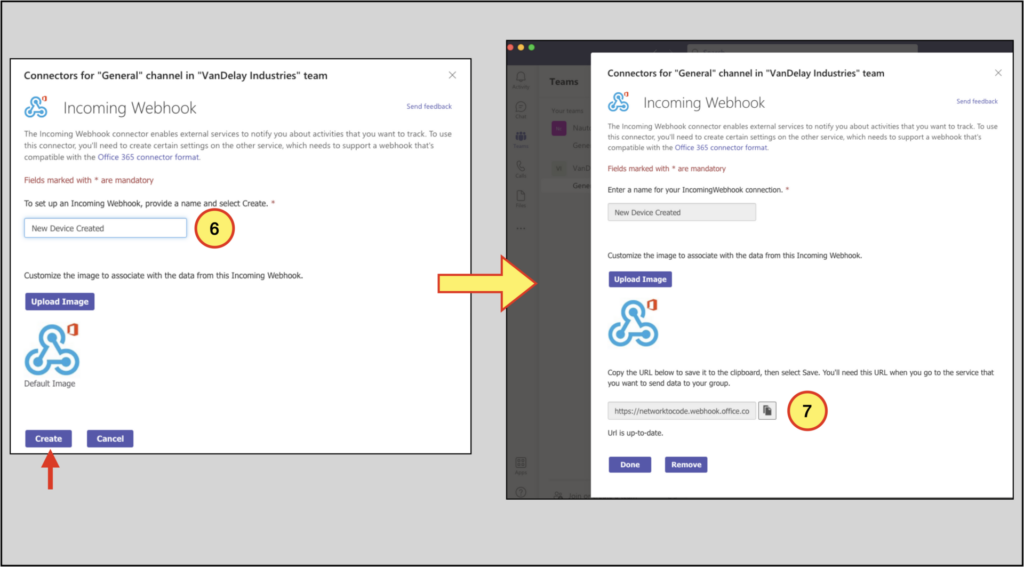
6. On the configuration screen, give the webhook a name and click Create.

7. You will be taken to a new screen that has a webhook URL. Copy that URL: this is the target URL for your webhook you’ll configure in Nautobot.

teams-setup-3

Configuring the Webhook in Nautobot

Webhooks are an Extensibility feature in Nautobot, and configuration is quite simple. To create the webhook for this example:

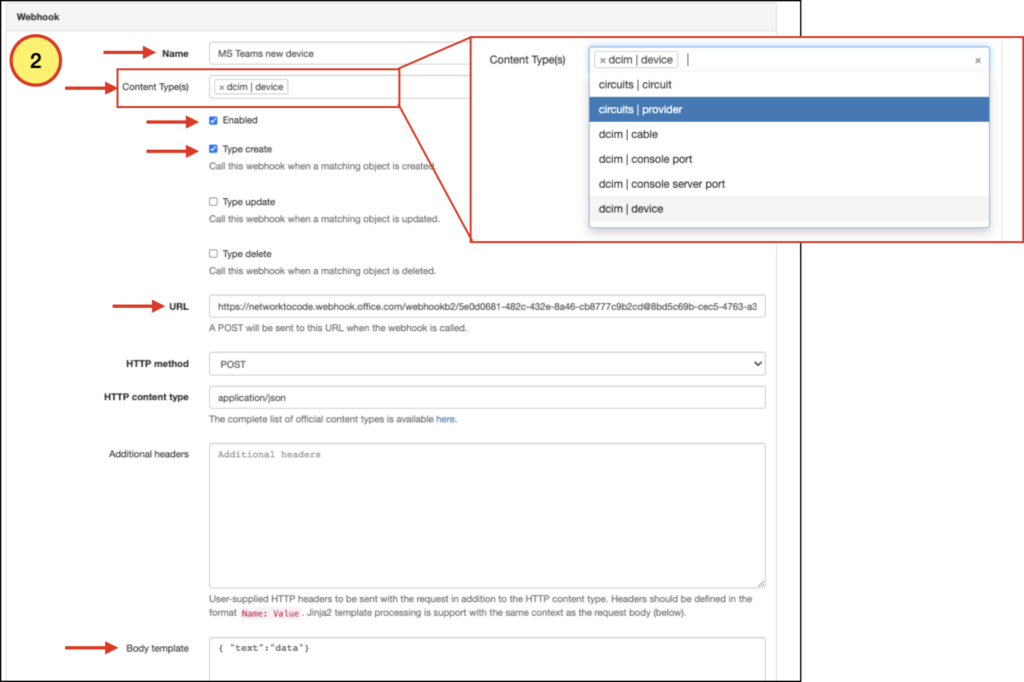
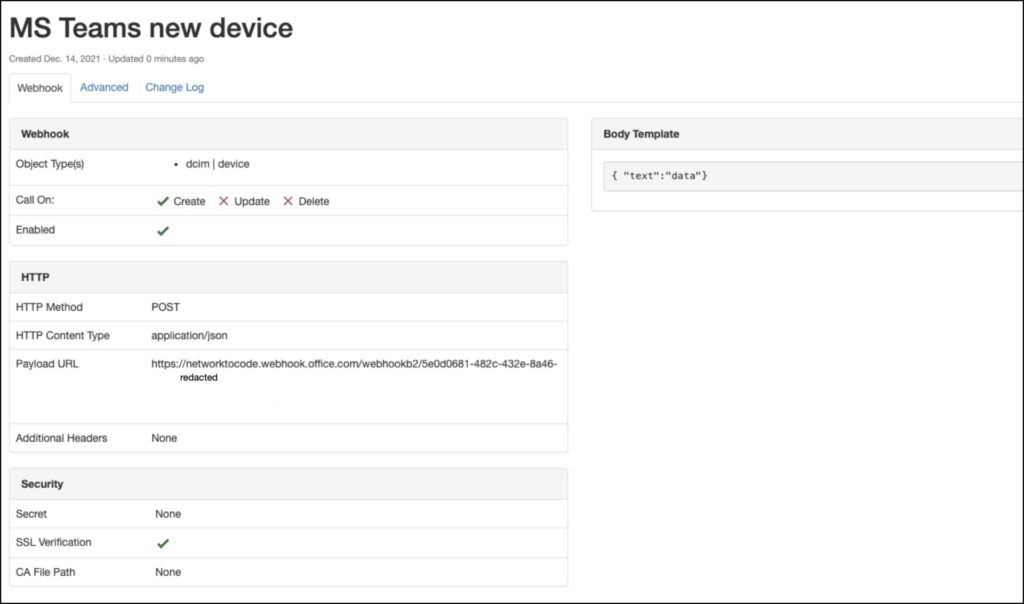
  1. Navigate to Extensibility –> Webhooks –> +
  2. Fill out the form, including:
    • Name
    • Specify the object(s) in the multi-selection drop-down menu (in our example the only object is DCIM | Device)
    • Enable the webhook
    • Specify the criteria for sending the webhook (create/update/delete) – select create for our example
    • Populate the URL section with the target URL that MS Teams gave us
    • Populate the Body template section with the JSON { “text”:”data” } for now (a later segment of this article will cover this section in more detail)
    • Click Create
4.2

At this point, we have a very simple webhook:

5.1

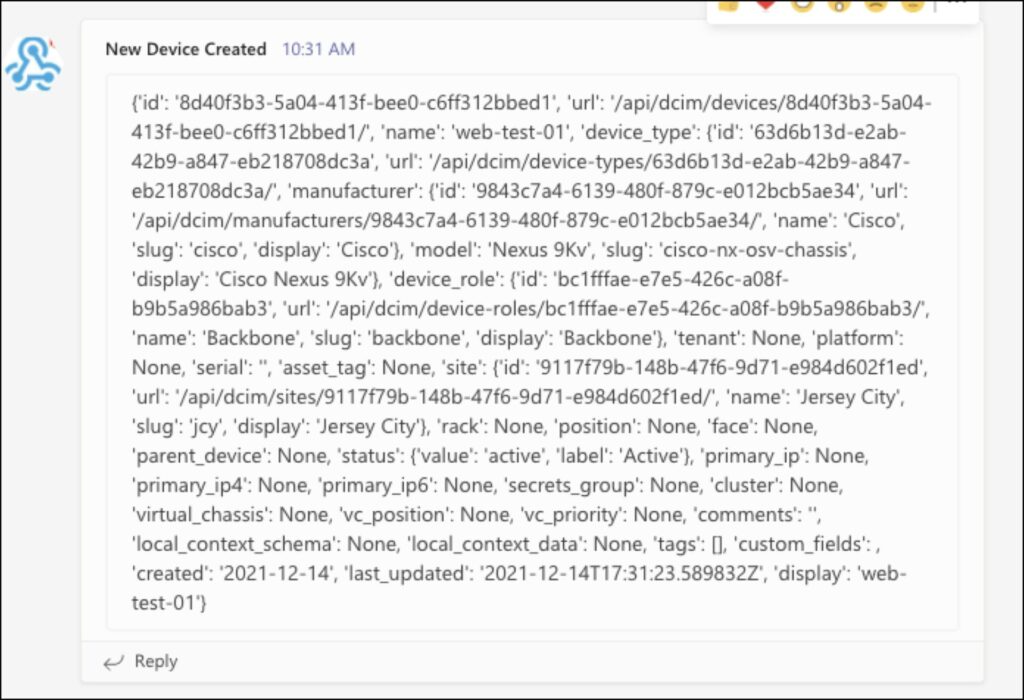
Let’s test it! Create a new device in Nautobot by navigating to Devices –> Devices –> + in the top-level Nautobot menu. Fill out the Add a new device form and click on the Create button. Your MS Teams channel should show a message that looks similar to this:

5.2

The Full Device Data Appendix has the complete JSON returned by the data context environment variable.

For the Body template section, we just included the data context variable for now, since that contains the richest set of information. The Nautobot documentation has more detailed information on webhook configuration and Jinja2 template support.

Since we sent all the data context variable to MS Teams, the output in our channel is a dump of the JSON within data. This is handy output to start because it gives us a visual of what attributes are present and what we can parse for. The next section digs into this and the notion of context variables a bit more.

TheBody templateSection

Let’s dig a bit deeper into the Body template section. This part of the webhook carries information to the receiving endpoint URL. Nautobot makes several context variables available for use in this section. The available context variables include: eventmodeltimestampusernamerequest_id, and data.

The entire Body template section (as well as the Additional headers section) supports Jinja2 templating. The user can access and parse the context variables via Jinja2 formatting.

If this section is left blank, Nautobot will populate the request body with a raw dump of the webhook context. Many platforms will not accept a pure JSON dump, as they require specific formatting. For example, MS Teams and Slack require the webhook info to be in a key, value pair format, with "text" as the key.

So, as an example, to send MS Teams the device name, and the username that created the device, the body template would be:

{ "text":"{{ data.name }} created by {{ username }}"}

Using info within the data and username context variables, let’s craft a more descriptive message to send to MS Teams:

{ "text":"New device created in Nautobot. Device '{{ data.name }}' created in site '{{ data.site.name }}' with status '{{ data.status.value }}' on '{{ data.created }}' by user '{{ username }}'"}

Update your webhook body template section with this data and create another device in Nautobot; you will see a more informative message in MS Teams:

6-msteams-msg

Webhooks and ChatOps Symmetry

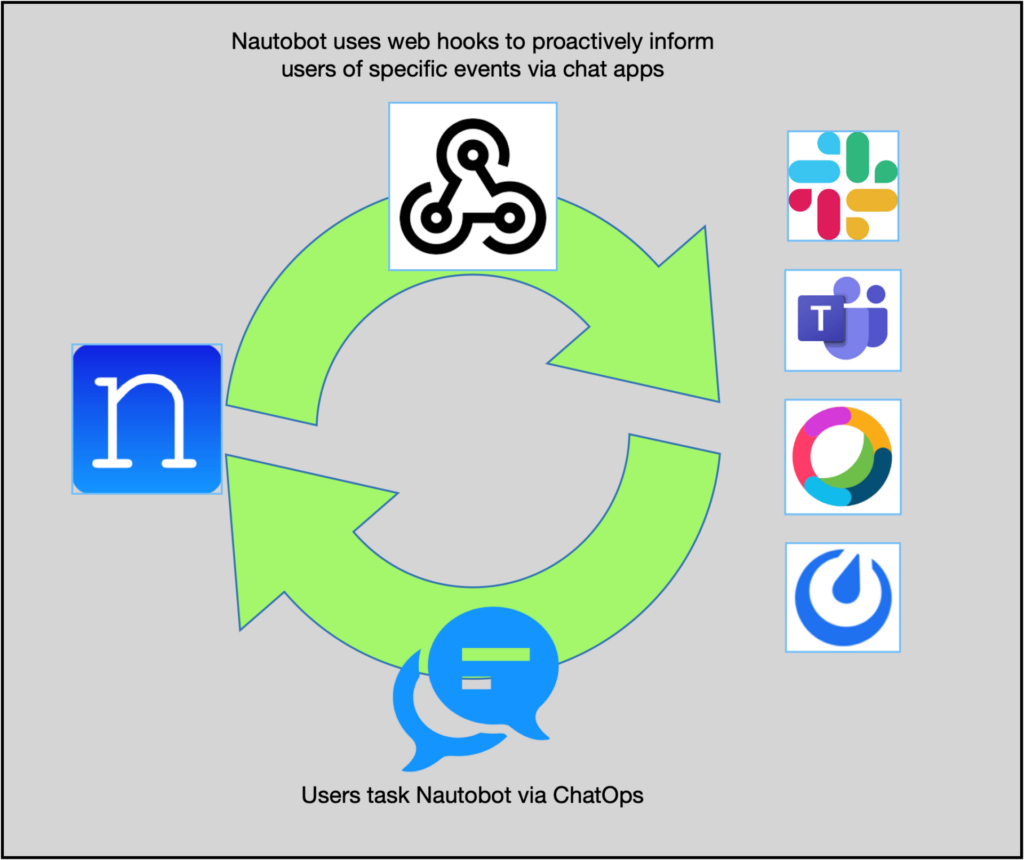
For those familiar with Nautobot’s ChatOps app and for those who may not be yet, I’d like to point out a symmetry here:

  • ChatOps allows a user to query Nautobot for information and to initiate other actions within Nautobot from a chat platform (Slack, MS Teams, Webex Teams, Mattermost).
  • Nautobot’s webhooks allow Nautobot to proactively communicate to users in their chat platform(s) when specific events happen.
7-symmetry

These two actions together form a back-and-forth synergy, making interaction with Nautobot more efficient.

Wrapping Up

Webhooks can play an important role in workflows because they coordinate activities between applications. As a central part of your automation infrastructure, Nautobot’s webhooks feature gives you another option for integration that best suits your environment.

Thank you for your time, and have a Happy New Year!

-Tim Fiola

Developer Advocate

Appendix: Full Device Data

This is the full json output for the newly created device:

{'id': '8d40f3b3-5a04-413f-bee0-c6ff312bbed1', 
  'url': '/api/dcim/devices/8d40f3b3-5a04-413f-bee0-c6ff312bbed1/', 
  'name': 'web-test-01', 
  'device_type': {
    'id': '63d6b13d-e2ab-42b9-a847-eb218708dc3a', 
    'url': '/api/dcim/device-types/63d6b13d-e2ab-42b9-a847-eb218708dc3a/', 
    'manufacturer': {
      'id': '9843c7a4-6139-480f-879c-e012bcb5ae34', 
      'url': '/api/dcim/manufacturers/9843c7a4-6139-480f-879c-e012bcb5ae34/', 
      'name': 'Cisco', 
      'slug': 'cisco', 
      'display': 'Cisco'
    }, 
    'model': 'Nexus 9Kv', 
    'slug': 'cisco-nx-osv-chassis', 
    'display': 'Cisco Nexus 9Kv'
  }, 'device_role': {
    'id': 'bc1fffae-e7e5-426c-a08f-b9b5a986bab3', 
    'url': '/api/dcim/device-roles/bc1fffae-e7e5-426c-a08f-b9b5a986bab3/', 
    'name': 'Backbone', 
    'slug': 'backbone', 
    'display': 'Backbone'
  }, 
  'tenant': None, 
  'platform': None, 
  'serial': '', 
  'asset_tag': None, 
  'site': {
    'id': '9117f79b-148b-47f6-9d71-e984d602f1ed', 
    'url': '/api/dcim/sites/9117f79b-148b-47f6-9d71-e984d602f1ed/', 
    'name': 'Jersey City', 
    'slug': 'jcy', 
    'display': 'Jersey City'
  }, 
  'rack': None, 
  'position': None, 
  'face': None, 
  'parent_device': None, 
  'status': {
    'value': 'active', 
    'label': 'Active'
  }, 
  'primary_ip': None, 
  'primary_ip4': None, 
  'primary_ip6': None, 
  'secrets_group': None, 
  'cluster': None, 
  'virtual_chassis': None, 
  'vc_position': None, 
  'vc_priority': None, 
  'comments': '', 
  'local_context_schema': None, 
  'local_context_data': None, 
  'tags': [], 
  'custom_fields': , 
  'created': '2021-12-14', 
  'last_updated': '2021-12-14T17:31:23.589832Z', 
  'display': 'web-test-01'}


ntc img
ntc img

Contact Us to Learn More

Share details about yourself & someone from our team will reach out to you ASAP!

Nautobot ChatOps for Grafana

Blog Detail

Two of the more intriguing topics I have heard lately that also seems to resonates with network engineers and network professionals is the insight telemetry provides, and the ease of use chat platforms such as Slack and Microsoft Teams deliver to your keyboard and fingertips. The Grafana ChatOps application is designed to provide the best of both worlds. Grafana ChatOps is a Nautobot extension used with the Nautobot ChatOps base framework to provide all the operational graphs provided by Grafana delivered via chat clients.

Today, we will walk through some of the features within the Grafana ChatOps integration, as well as some of the requirements and procedures to get up and running with Grafana ChatOps.

An important note on the architecture design choices with this ChatOps app (plugin) is that chat commands are defined dynamically based on the Grafana panels and dashboards (we’ll go into this a little later). When you launch the app for the first time, you will see that no chat commands have been defined yet. You can define commands automatically or manually and tie them to specific Grafana panels within a dashboard.

Installation

The package for the Grafana ChatOps app is available on PyPI and can be installed using pip.

Prior to installing the Nautobot Grafana Plugin, you should have the following installed:

For the full installation guide, please refer to the Grafana ChatOps repo Install Guide.

Usage

Building Grafana ChatOps commands can be done using a manual or automated approach. The automated approach uses the DiffSync library to synchronize Grafana dashboards, panels, and variables with the Nautobot Grafana ChatOps plugin.

Defining Commands

To define a command within the Grafana plugin for use with your chat client, there are two main components that we need to have populated.

  • Define at least one Grafana Dashboard.
  • Define at least one Grafana Panel within the Dashboard.

This tutorial will take you through the steps noted above to get a chat command exposed in your chat client.

The first step is to define a dashboard so that the Grafana plugin is aware of the dashboard that exists within Grafana. You can define a dashboard in Grafana in two ways: defining a dashboard manually or using the “Sync” feature to synchronize your Grafana dashboards automatically.

Defining a Dashboard Manually

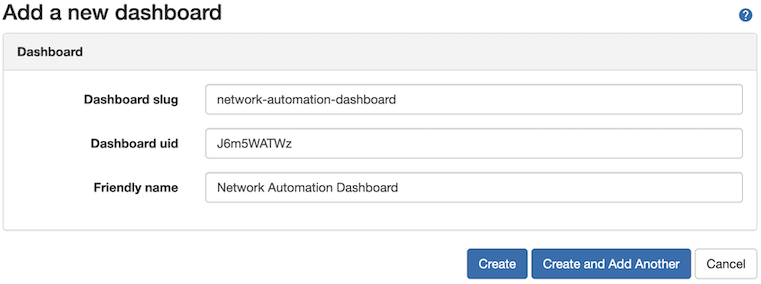
To define a dashboard manually, you can go to Plugins > Dashboards and click the + Add button located in the upper right of the screen. In the form for a new dashboard, you need to define the sluguid, and Friendly Name.

New Dashboard

NOTE: You can find the slug and uid info by navigating to your Grafana instance and going to the desired dashboard, 

New Dashboard

Defining a Dashboard Using the Sync Method

Alternatively, you can define a set of dashboards by synchronizing your Grafana dashboard configuration to the Grafana plugin. To synchronize dashboards, within Nautobot, navigate to Plugins > Dashboards and click the Sync button.

This process will utilize the DiffSync library to synchronize, create, update, and delete dashboards in Nautobot with the Dashboards that are defined in the Grafana application. Once complete, you will see all dashboards imported into Nautobot.

Defining Grafana Panels

The second step to defining Grafana commands in Nautobot for your chat client is to define the panels you wish to expose via chat.

Panels are closely associated to chat commands, where there will be a chat command for each panel defined.

Similar to dashboards, you can define panels in two ways within Nautobot.

Defining a Panel Manually

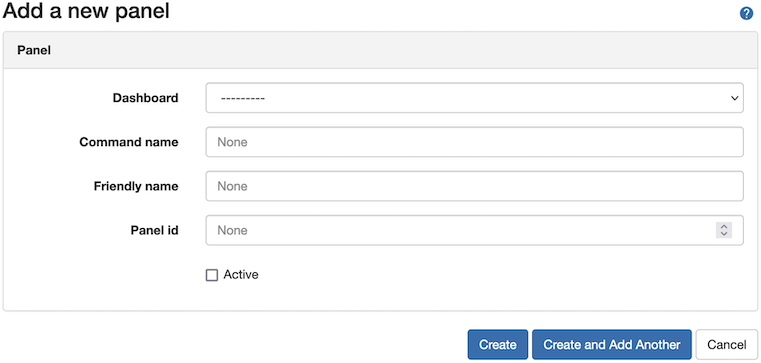
To define a panel manually, go to Plugins > Panels and click the + Add button located in the upper right of the screen. In the modal for a new panel, you need to select the dashboard that the panel is defined under, then add a command name, along with a friendly name, and define the Panel ID.

The Active checkbox will allow the command to show up in your chat client. If the panel is marked as inactive, it will still be defined in Nautobot, but restricted from being shown in the chat client.

new panel

NOTE: You can find the panel id by navigating to your desired panel, selecting View, then looking at the URL. 

New Panel

Defining Panels Using the Sync Method

Alternatively, you can define a set of panels by synchronizing your Grafana panels configuration for a given dashboard to the Grafana plugin. To synchronize panels for a dashboard, within Nautobot, navigate to Plugins > Panels and click the Sync button.

This process will utilize the DiffSync library to synchronize, create, update, and delete panels in Nautobot with the Dashboard Panels that are defined in the Grafana application. Once complete, you will see all panels for a dashboard imported into Nautobot.

Panels are synchronized on a per-dashboard basis. All panels synchronized will be INACTIVE by default, you will need to set them to active to see them in Chat.

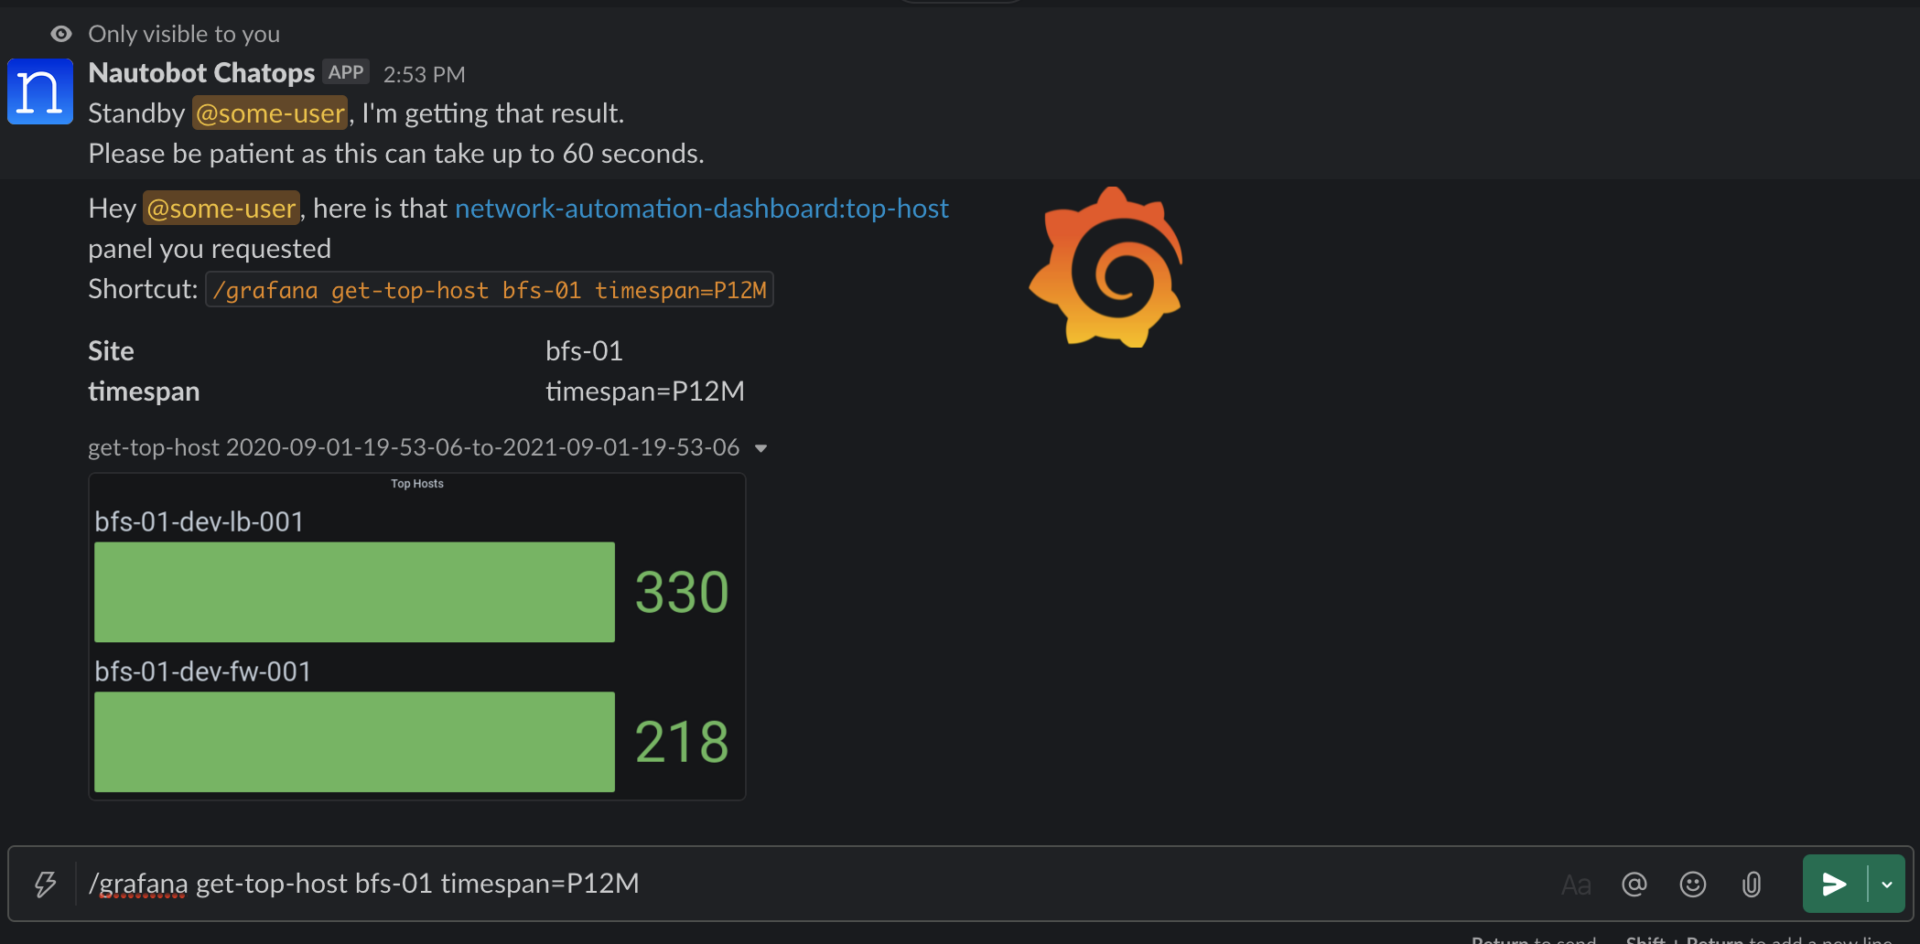
Once your dashboard and panels have been defined, and you activate the panels you wish to expose to the chat client, you will be able to see the available chat commands, as well as run commands to generate your panels. Chat Example

Advanced Usage

Additional functionality can be added to the Grafana ChatOps plugin if you have variables defined on your dashboards. Panel variables can also be imported via the “Sync” functionality and associated with a panel. Then you can go in and customize how the variables behave and even enrich the ChatOps experience using Nautobot as a Source of Truth for your variables!

To read more on the advanced usage of the Grafana ChatOps plugin with panel variables, refer to the Advanced Usage Guide in the repository.


Conclusion

ChatOps has given a conduit to retrieve and respond interactively using a platform that is already in place and used for communication across almost any device, while Grafana has provided a feature-rich observability platform. With the Nautobot Grafana integration, we can now have the best of both worlds. Let us know how you’re using the Grafana ChatOps or if you have any questions or issues in the GitHub repo.

-Josh Silvas


ntc img
ntc img

Contact Us to Learn More

Share details about yourself & someone from our team will reach out to you ASAP!