Network Automation Architecture – The Components
In the first blog of the Network Automation Architecture blog series, we exposed our motivations and introduced, briefly, the six components that compose it. This blog goes a bit deeper by providing more details, to provide a better understanding of each component scope.
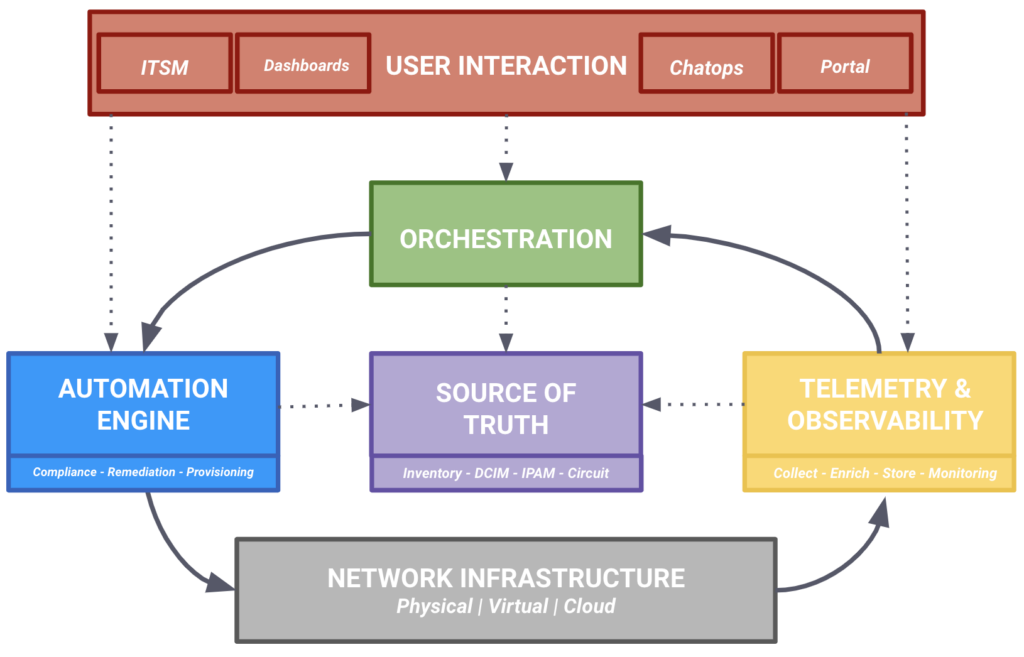
As a refresh, this was the diagram describing the network automation architecture proposed:

This blog should provide you a good overview of the architecture as a whole to start understanding the role of each of its components. However, it’s not in the scope of this blog to go deep on any of them, that will happen in the next blogs of this series.
A similar architecture could also be used to automate other types of IT infrastructure. What makes the proposal “special” is the focus on networking. So, it does make sense to start first with the component that influences the rest, the Network Infrastructure.
Network Infrastructure
During the last few years, the “network” has evolved from being physical network devices to also including network virtualized functions, network controllers, and abstract network services provided by Cloud platforms. All these types of network infrastructure are targets for automation, each one with their own characteristics.
Along with the different network platforms, new ways for interaction have been added on top of the traditional SNMP and CLI interfaces. New interfaces, such as Linux API/Shell, NETCONF, RESTCONF, gNMI, or popular REST APIs, are now common ways to interact with network infrastructure. This makes automation integration much easier, and more capable.
It is not in the scope of this blog series to go deep on the details of each network type, but it’s important to keep in mind that the network automation architecture scope includes ALL of them, and we should take their features and limitations into account when determining the right tooling in each component.
There are some books available that will help you to learn about this topic, such as Network Programmability with YANG by Pearson, Network Programmability and Automation Fundamentals by Cisco Press, or Network Programmability and Automation (2nd edition) by O’Reilly.
Once we know what we want to automate, let’s move to how we interact with the network automation solutions.
User Interactions
In the end, a human(user) will interact with the automation solution. We call these entry points, User Interactions, that can be in different forms (as we can have different personas using it). There are multiple options in this space, for instance:
- Web Portals
- Dashboards
- Command Line Interface (CLI)
- Instance Messaging systems

Each one of them covers different use cases, so it is critical to identify who will use the solution to identify the proper user interaction, the how. For instance, a network engineer would be happy with a CLI-based tool, but an end user would require a web portal.
Next, we will discuss the brain of the network automation architecture, the Source of Truth.
Source of Truth
In short, the Source of Truth is where we store, and expose, all the data that defines the intended state of the network. Does it sound obvious? It may be the case if you come from an infrastructure automation background, but it is a radical change to traditional network operations.
Traditionally, networks have been designed in generic diagrams in manually generated documents. Then, this reference is interpreted by a network engineer into a device’s running configuration, that will keep evolving over time as new designs, features, or changes are added.
The Source of Truth concept is common in any infrastructure automation environment, being the reference point when evaluating if the operational state is matching the desired one. It can take multiple implementations, from centralized to distributed, but it’s always built on top of the concept of System of Record, the data source that owns a particular piece of data.
The SoT contains different data types in the networking space, as represented in the following diagram.

After this brief introduction to the SoT, now it’s time to move to the next component, the Orchestration.
Orchestration
When a network automation solution encompasses more than one task (quite common), there is the need to concatenate multiple tasks. This could range from a simple chaining to a complex combination of steps that depend on multiple interactions. Orchestration is what connects the dots in a network automation solution, and it can be implemented in multiple ways: human interactions, task schedulers, programmatic triggers, or listening to an event in a pub/sub paradigm.
One popular implementation paradigm is the event-driven network automation, where the network automation engine tasks are triggered by events generated internally or external. This approach offers a scalable and flexible way to interact with multiple automation components.
Next, we introduce what people usually associate with network automation solutions: interacting with the network infrastructure via programmatic access, the Automation Engine.
Automation Engine
This component contains all the tasks that interact with the network (via its available interfaces)—usually, to change the state of the network via configuration management processes. It’s important to understand this component not as an isolated one, but as the final executor of the outcome of the other components.
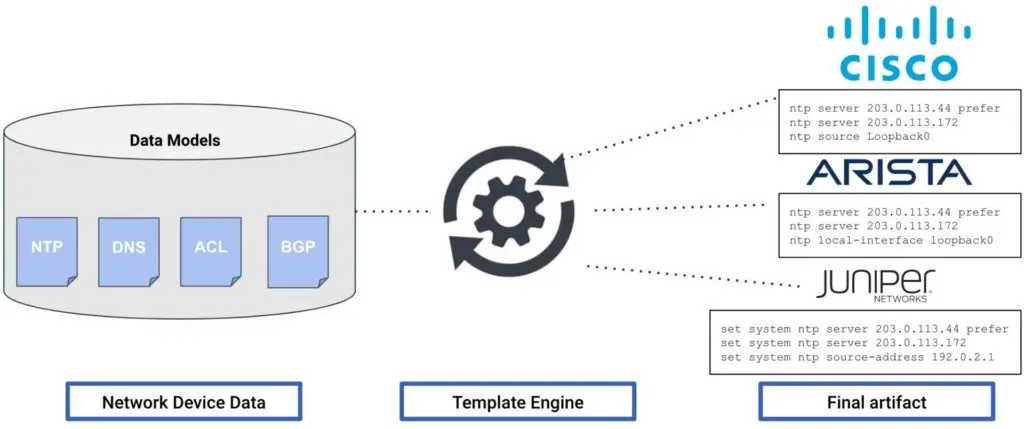
What we define as our intended state in the Source of Truth is what the automation engine will use to create the configuration artifacts necessary to move the network, from its current state to the intended state. A common use case is using Jinja templates with CLI commands, where the data variables are rendered for a specific network device.

Finally, it’s time to move to the last one, the Telemetry and Observability. There, instead of changing the state of the network as we did in the Automation Engine, we will be retrieving and storing the actual operational state.
Telemetry and Observability
Observability goes further than the traditional network monitoring approach, knowing that something is wrong, to understanding why something is wrong. It supersedes traditional monitoring, embracing data-model-driven streaming telemetry to improve operations via better visibility. It starts by collecting operational state from the network, and then making it available (with enrichment) to other components within the architecture. For instance, to implement close-loop automation, or simply exposing the information to the user via dashboard or alerts.
It encompasses different types of collected data: metrics, logs, and network flows. The data will come from different interfaces through a data pipeline ingestion process. But, before storing it, using the context from the Source of Truth, we enrich it with metadata that would improve its consumption via User Interactions, or triggering a remediation task via the Automation Engine when an anomaly between the expected and actual state is detected.
There is already a blog series about the Telemetry Stack proposed by Network to Code, but an architecture-focused blog will come about this topic.
Other Considerations
As we already introduced in the first blog, all the components of this architecture are implicitly leveraging software architecture best practices.
For the sake of brevity and cleanliness, the architecture focuses only on the intra-system communications, and not on the multiple potential inter-system communications, that are obviously part of any real implementation. All these API integrations are depicted as the lines between the components in the architecture.
According to the same brevity principle, other considerations such as CI/CD pipelines, scalability, and security constraints are not included in this analysis, but should be taken into account according each environment. Only, some special integration will be highlighted, for example a CI pipeline leveraging the Automation Engine for rendering configuration artifacts.
Next Steps
This blog went deeper into introducing the network automation architecture that Network to Code uses. In the coming blogs in this series we will deep dive to offer a more detailed description of each component.
We know it’s not the sole reference available (for instance, a few weeks ago an informative RFC9315 for Intent-Based Networking was published by IETF), but it really helps us to build effective network automation solutions, and improve its understanding, maintainability, and extensibility.
Conclusion
The next blog in this series will describe an actual use case that will leverage this architecture, adopting a network automation mindset.
-Christian
Contact Us to Learn More
Share details about yourself & someone from our team will reach out to you ASAP!
