This is going to be the first in a multipart series where I will be taking a look at a method to get telemetry data from network devices into a modern Time Series Database (TSDB).
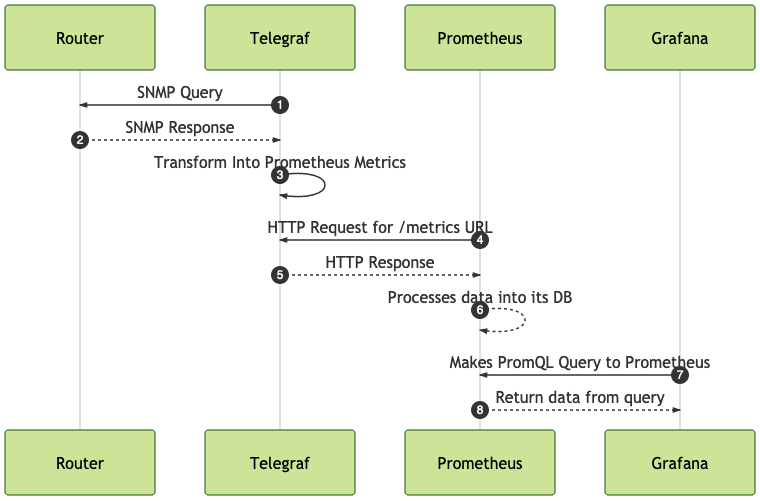
In this particular post I will be working through adding SNMP based device data into the Prometheus TSDB. I will be using Telegraf from InfluxData to gather the SNMP data from Cisco devices on an emulation platform. Prometheus will then scrape the data from Telegraf and store the metrics. I will then show in how to start building out graphs within Grafana.
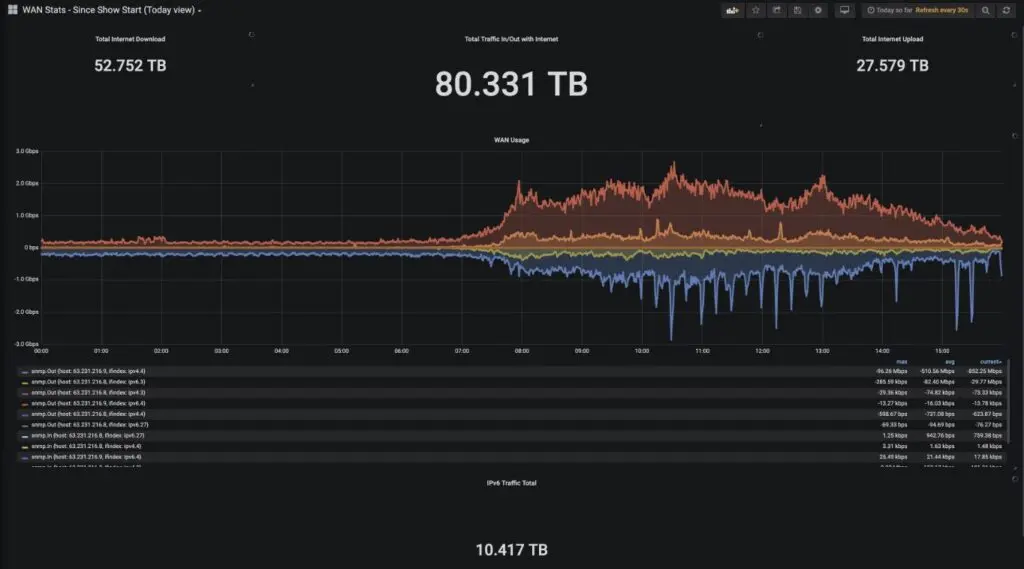
Here is an example of a Grafana dashboard that could be made:
At this point there are many advertisements that Streaming Telemetry is a must have in this day and age for gathering network device metrics. However, there are still quite a few network devices that do not support Streaming Telemetry in networks today. If you have a large deployment of these types of devices are you out of luck if you want to use a modern TSDBs? No you are not. Gathering data into a TSDB is all about just that, gathering data. If you gather the data via Streaming Telemetry or SNMP, either way, you are gathering the data. Streaming Telemetry is generally thought of as less intensive of a process on devices and has some other benefits. So if you can gather the data with Streaming Telemetry, then you should. But if you must use SNMP, this article is here to help you out.
Through this post you will see information gathered via SNMP. If you wish to look at using CLI parsing as a method to get metrics, take a look at our previous post.
This post will outline what Telegraf has to offer when it comes to gathering data. Telegraf is an application made available by InfluxData that will gather data from various places. The gathering of information is known as an input. Then you will see how to send or make the data available for TSDB – Prometheus. These are known as the outputs. You can take a look at the plugins list to see the list of plugins for Telegraf 1.14, which as of this writing (2020-04-21) is the latest version.
Telegraf has the capability to also transform, tag, and modify data as needed. Portions of that will be covered in a follow-up post.
Within the configuration files you can setup to have a single Telegraf process poll multiple devices or you can have multiple Telegraf processes or containers, with each one polling one device. In this post I will be showing how to configure a single device to be polled by Telegraf. By this nature you can have your Telegraf agents centralized or distributed as needed.
A Prometheus nuance is that Prometheus will assume a device is down if Prometheus is unable to scrape the device’s metric page. But collecting SNMP data, the collection will be of the Telegraf process, which should get tied to its ability to poll the device. So additional configuration will be needed for Prometheus alerting in respects to reading metrics from a Telegraf plugin.
The SNMP configuration is made within the Telegraf configuration. This configuration may look like the following:
[[inputs.snmp]]
  agents = ["minneapolis.ntc"]
  version = 2
  community = "SecuredSNMPString"
  interval = "60s"
  timeout = "10s"
  retries = 3

  [[inputs.snmp.field]]
    name = "hostname"
    oid = ".1.3.6.1.2.1.1.5.0"
    is_tag = true

  [[inputs.snmp.field]]
    name = "uptime"
    oid = "1.3.6.1.2.1.1.3.0"

  [[inputs.snmp.field]]
    name = "cpmCPUTotal1min"
    oid = ".1.3.6.1.4.1.9.9.109.1.1.1.1.4.7"

  #####################################################
  #
  # Gather Interface Statistics via SNMP
  #
  #####################################################

  # IF-MIB::ifTable contains counters on input and output traffic as well as errors and discards.
  [[inputs.snmp.table]]
    name = "interface"
    inherit_tags = [ "hostname" ]
    oid = "IF-MIB::ifTable"

    # Interface tag - used to identify interface in metrics database
    [[inputs.snmp.table.field]]
      name = "name"
      oid = "IF-MIB::ifDescr"
      is_tag = true

  # IF-MIB::ifXTable contains newer High Capacity (HC) counters that do not overflow as fast for a few of the ifTable counters
  [[inputs.snmp.table]]
    name = "interface"
    inherit_tags = [ "hostname" ]
    oid = "IF-MIB::ifXTable"

    # Interface tag - used to identify interface in metrics database
    [[inputs.snmp.table.field]]
      name = "name"
      oid = "IF-MIB::ifDescr"
      is_tag = true

  # EtherLike-MIB::dot3StatsTable contains detailed ethernet-level information about what kind of errors have been logged on an interface (such as FCS error, frame too long, etc)
  [[inputs.snmp.table]]
    name = "interface"
    inherit_tags = [ "hostname" ]
    oid = "EtherLike-MIB::dot3StatsTable"

    # Interface tag - used to identify interface in metrics database
    [[inputs.snmp.table.field]]
      name = "name"
      oid = "IF-MIB::ifDescr"
      is_tag = true
Note: In testing I have found that the Cisco CPU query can be different per device. I recommend testing per platform and perhaps per OS version to verify that the SNMP polling works properly. I have found that issuing the command
snmpwalk -v 2c -c SecuredSNMPString minneapolis.ntc .1.3.6.1.4.1.9.9.109.1.1.1.1.4to find the response. You can also look at some other SNMP OIDs available as well for Cisco at their doc page
Now, we’ll briefly dig in to what each of the lines are doing here. When an SNMP field is defined, this is going to act like an snmpget on a device. The first section that we call hostname is getting the hostname of the device.
The is_tag will be used as a tag on the data that is called later. Tags are data points that will help to classify other pieces of information. This can be helpful in filtering data points, or associating data points with a particular query or other data point.
Tags will be covered in more detail in a subsequent post, but note that by leveraging tags in your templates that build the Telegraf configuration you are able to identify key components in the environment that will enhance the monitoring capabilities.
Jumping ahead, and using the Prometheus output you can see some of these tags and fields in action. snmp_ is added to the front of the name as a part of the Prometheus export. You are able see the result of the query on the right most, outside of the {}. Inside of the {} you have the various tags that are being applied.
# HELP snmp_cpmCPUTotal1min Telegraf collected metric
# TYPE snmp_cpmCPUTotal1min untyped
snmp_cpmCPUTotal1min{agent_host="minneapolis.ntc",device="minneapolis",host="225bb1fc7f4c",hostname="minneapolis.ntc",} 31
# HELP snmp_uptime Telegraf collected metric
# TYPE snmp_uptime untyped
snmp_uptime{agent_host="minneapolis.ntc",device="minneapolis",host="225bb1fc7f4c",hostname="minneapolis.ntc",} 1.2636057e+07
There are two majority leaders in my opinion in the open source TSDB market, InfluxDB and Prometheus. Both have outputs that you can leverage with Telegraf to get the data into the TSDB. I will focus on the Prometheus methodology here. By exporting data with the Prometheus output there are a couple of benefits. One, the data is able to be scraped by the Prometheus system. The second is you can get a very good visual representation of the data for troubleshooting your connections.
If you are using InfluxDB as your DB and need to troubleshoot, I find setting up a Prometheus exporter as a helpful step to be able to see what tags are being defined and what data is being gathered from an SNMP standpoint.
The configuration for Telegraf to use the Prometheus metrics exporter is relatively short and sweet. Telegraf handles the heavy lifting once you set the configuration file.
#####################################################
#
# Export SNMP Information to Prometheus
#
#####################################################

[[outputs.prometheus_client]]
  listen = ":9012"
  metric_version = 2
Here you see that the section begins with [[outputs.prometheus_client]]. This is with no indentation within the configuration file. It sets the metric_version to 2, and then sets a port that the metrics will be exposed at on, here tcp/9012. The url is then http://<server_url/ip>:<listen_port>/metrics. Note the /metrics as defined is a best practice of Prometheus.
Let’s take a look at the output from the metrics page below. There are many more metrics that get exposed than just what is shown. This will show only the one related to octets inbound on the interface.
Within the tags you see the main metric name begins with interface_. This is added by the client exporter to assist in classification of the metric. You then see the actual metric name as collected by SNMP. Here it is appended to the end of interface_ to get the metric name.
You also see the tags that are assigned to the metric being presented. Below is a table of the tag and where it came from:
| Tag | Came From |
|---|---|
| agent_host | Created by Telegraf |
| host | Host that is collecting the data, here the name of the Docker container |
| hostname | Tag defined within the input section for gathering the hostname, the input section specifies inherit_tags to inherit the hostname |
| ifName | Within the inputs.snmp.table.field section of the ifTable, noted by is_tag |
| name | The name of the interface, defined in the input section |
After the tags, the Prometheus metric definition indicates that this is where the actual measurement is to be placed. The Prometheus engine will “scrape” this information from the HTTP page and then ingest the data appropriately into its DB.
# HELP interface_ifHCInOctets Telegraf collected metric
# TYPE interface_ifHCInOctets untyped
interface_ifHCInOctets{agent_host="minneapolis.ntc",host="225bb1fc7f4c",hostname="minneapolis.ntc",ifName="Gi1",name="GigabitEthernet1"} 2.4956199e+07
interface_ifHCInOctets{agent_host="minneapolis.ntc",host="225bb1fc7f4c",hostname="minneapolis.ntc",ifName="Gi7",name="GigabitEthernet7"} 0
interface_ifHCInOctets{agent_host="minneapolis.ntc",host="225bb1fc7f4c",hostname="minneapolis.ntc",ifName="Gi8",name="GigabitEthernet8",} 0
interface_ifHCInOctets{agent_host="minneapolis.ntc",host="225bb1fc7f4c",hostname="minneapolis.ntc",ifName="Nu0",name="Null0",} 0
interface_ifHCInOctets{agent_host="minneapolis.ntc",host="225bb1fc7f4c",hostname="minneapolis.ntc",ifName="Vo0",name="VoIP-Null0",} 0
interface_ifHCInOctets{agent_host="minneapolis.ntc",host="225bb1fc7f4c",hostname="minneapolis.ntc",ifName="Gi3",name="GigabitEthernet3",} 1.092917e+08
interface_ifHCInOctets{agent_host="minneapolis.ntc",host="225bb1fc7f4c",hostname="minneapolis.ntc",ifName="Gi2",name="GigabitEthernet2",} 1.477766e+06
interface_ifHCInOctets{agent_host="minneapolis.ntc",host="225bb1fc7f4c",hostname="minneapolis.ntc",ifName="Gi4",name="GigabitEthernet4",} 1.9447063e+07
interface_ifHCInOctets{agent_host="minneapolis.ntc",host="225bb1fc7f4c",hostname="minneapolis.ntc",ifName="Gi5",name="GigabitEthernet5",} 1.2468643e+07
interface_ifHCInOctets{agent_host="minneapolis.ntc",host="225bb1fc7f4c",hostname="minneapolis.ntc",ifName="Gi6",name="GigabitEthernet6",} 1.6549974e+07
After getting the data into a format that Prometheus can read, you need to install Prometheus. You will get a link for the long lived installation, but the best part about Prometheus is that you can get up and running by just executing the binary file.
Link: Prometheus installation provides for documentation on getting Prometheus up and running on your system.
For this the installation will be of the 2.16.0 version that has a download link of https://github.com/prometheus/prometheus/releases/download/v2.16.0/prometheus-2.16.0.linux-amd64.tar.gz.
On a Linux host, wget is able to download the file into your local working directory.
josh@prometheus_demo:~$ wget https://github.com/prometheus/prometheus/releases/download/v2.16.0/prometheus-2.16.0.linux-amd64.tar.gz
--2020-03-14 18:20:41--  https://github.com/prometheus/prometheus/releases/download/v2.16.0/prometheus-2.16.0.linux-amd64.tar.gz
Resolving github.com (github.com)... 140.82.114.3
Connecting to github.com (github.com)|140.82.114.3|:443... connected.
HTTP request sent, awaiting response... 302 Found
Location: https://github-production-release-asset-2e65be.s3.amazonaws.com/6838921/13326f00-4ede-11ea-98d2-3ed3a8fdfe99?X-Amz-Algorithm=AWS4-HMAC-SHA256&X-Amz-Credential=AKIAIWNJYAX4CSVEH53A%2F20200314%2Fus-east-1%2Fs3%2Faws4_request&X-Amz-Date=20200314T182041Z&X-Amz-Expires=300&X-Amz-Signature=9d4b3578b43c357056d75698f94bf8fb3263510787046db5fe04fabd3196023a&X-Amz-SignedHeaders=host&actor_id=0&response-content-disposition=attachment%3B%20filename%3Dprometheus-2.16.0.linux-amd64.tar.gz&response-content-type=application%2Foctet-stream [following]
--2020-03-14 18:20:41--  https://github-production-release-asset-2e65be.s3.amazonaws.com/6838921/13326f00-4ede-11ea-98d2-3ed3a8fdfe99?X-Amz-Algorithm=AWS4-HMAC-SHA256&X-Amz-Credential=AKIAIWNJYAX4CSVEH53A%2F20200314%2Fus-east-1%2Fs3%2Faws4_request&X-Amz-Date=20200314T182041Z&X-Amz-Expires=300&X-Amz-Signature=9d4b3578b43c357056d75698f94bf8fb3263510787046db5fe04fabd3196023a&X-Amz-SignedHeaders=host&actor_id=0&response-content-disposition=attachment%3B%20filename%3Dprometheus-2.16.0.linux-amd64.tar.gz&response-content-type=application%2Foctet-stream
Resolving github-production-release-asset-2e65be.s3.amazonaws.com (github-production-release-asset-2e65be.s3.amazonaws.com)... 52.216.238.3
Connecting to github-production-release-asset-2e65be.s3.amazonaws.com (github-production-release-asset-2e65be.s3.amazonaws.com)|52.216.238.3|:443... connected.
HTTP request sent, awaiting response... 200 OK
Length: 59608515 (57M) [application/octet-stream]
Saving to: ‘prometheus-2.16.0.linux-amd64.tar.gz’

prometheus-2.16.0.linux-amd64.tar.gz        100%[==========================================================================================>]  56.85M  23.8MB/s    in 2.4s

2020-03-14 18:20:44 (23.8 MB/s) - ‘prometheus-2.16.0.linux-amd64.tar.gz’ saved [59608515/59608515]
josh@prometheus_demo:~$ tar -xvzf prometheus-2.16.0.linux-amd64.tar.gz
prometheus-2.16.0.linux-amd64/
prometheus-2.16.0.linux-amd64/LICENSE
prometheus-2.16.0.linux-amd64/promtool
prometheus-2.16.0.linux-amd64/NOTICE
prometheus-2.16.0.linux-amd64/consoles/
prometheus-2.16.0.linux-amd64/consoles/node.html
prometheus-2.16.0.linux-amd64/consoles/index.html.example
prometheus-2.16.0.linux-amd64/consoles/prometheus-overview.html
prometheus-2.16.0.linux-amd64/consoles/node-disk.html
prometheus-2.16.0.linux-amd64/consoles/node-overview.html
prometheus-2.16.0.linux-amd64/consoles/node-cpu.html
prometheus-2.16.0.linux-amd64/consoles/prometheus.html
prometheus-2.16.0.linux-amd64/console_libraries/
prometheus-2.16.0.linux-amd64/console_libraries/menu.lib
prometheus-2.16.0.linux-amd64/console_libraries/prom.lib
prometheus-2.16.0.linux-amd64/prometheus
prometheus-2.16.0.linux-amd64/prometheus.yml
prometheus-2.16.0.linux-amd64/tsdb
cp prometheus-2.16.0.linux-amd64/prometheus .
You can use this as a start of the configuration, it will be stored in the same local directory that you are working in. It is setting a default scrape interval for other jobs that do not have a scrape_interval set to 15s. The example will use prometheus_config.yml for the file name.
global:
  scrape_interval: "15s"

scrape_configs:
  - job_name: 'prometheus'
    scrape_interval: "5s"
    static_configs:
      - targets: ['localhost:9090']
Now that there is a configuration file ready to go, you can start the local server. This will start up without polling anything other than the local Prometheus instance.
josh@prometheus_demo:~$ ./prometheus --config.file="prometheus_config.yml"
level=info ts=2020-03-14T18:29:50.782Z caller=main.go:295 msg="no time or size retention was set so using the default time retention" duration=15d
level=info ts=2020-03-14T18:29:50.783Z caller=main.go:331 msg="Starting Prometheus" version="(version=2.16.0, branch=HEAD, revision=b90be6f32a33c03163d700e1452b54454ddce0ec)"
level=info ts=2020-03-14T18:29:50.783Z caller=main.go:332 build_context="(go=go1.13.8, user=root@7ea0ae865f12, date=20200213-23:50:02)"
level=info ts=2020-03-14T18:29:50.783Z caller=main.go:333 host_details="(Linux 4.15.0-88-generic #88-Ubuntu SMP Tue Feb 11 20:11:34 UTC 2020 x86_64 prometheus_demo (none))"
level=info ts=2020-03-14T18:29:50.783Z caller=main.go:334 fd_limits="(soft=1024, hard=1048576)"
level=info ts=2020-03-14T18:29:50.783Z caller=main.go:335 vm_limits="(soft=unlimited, hard=unlimited)"
level=info ts=2020-03-14T18:29:50.784Z caller=web.go:508 component=web msg="Start listening for connections" address=0.0.0.0:9090
level=info ts=2020-03-14T18:29:50.784Z caller=main.go:661 msg="Starting TSDB ..."
level=info ts=2020-03-14T18:29:50.788Z caller=head.go:577 component=tsdb msg="replaying WAL, this may take awhile"
level=info ts=2020-03-14T18:29:50.788Z caller=head.go:625 component=tsdb msg="WAL segment loaded" segment=0 maxSegment=2
level=info ts=2020-03-14T18:29:50.788Z caller=head.go:625 component=tsdb msg="WAL segment loaded" segment=1 maxSegment=2
level=info ts=2020-03-14T18:29:50.788Z caller=head.go:625 component=tsdb msg="WAL segment loaded" segment=2 maxSegment=2
level=info ts=2020-03-14T18:29:50.789Z caller=main.go:676 fs_type=EXT4_SUPER_MAGIC
level=info ts=2020-03-14T18:29:50.789Z caller=main.go:677 msg="TSDB started"
level=info ts=2020-03-14T18:29:50.790Z caller=main.go:747 msg="Loading configuration file" filename=prometheus_config.yml
level=info ts=2020-03-14T18:29:50.790Z caller=main.go:775 msg="Completed loading of configuration file" filename=prometheus_config.yml
level=info ts=2020-03-14T18:29:50.790Z caller=main.go:630 msg="Server is ready to receive web requests."
At the end you should see a message that states that the Server is ready to receive web requests.
With a web browser, open to the URL: http://<server_ip>:9090 or if using a local installation http://localhost:9090 which should add a redirect to /graph and bring you to a screen like this:
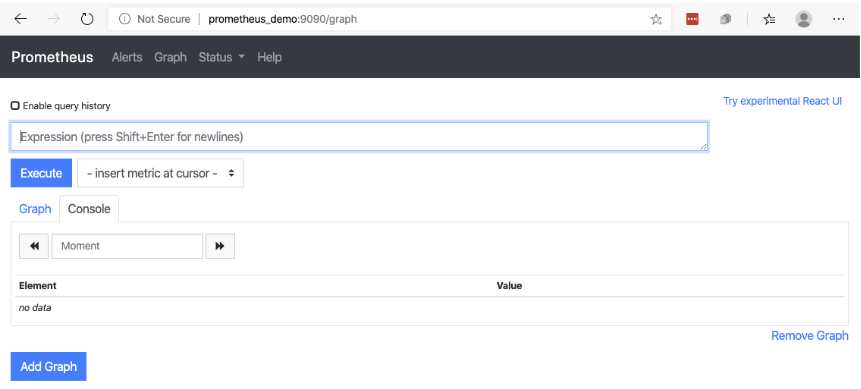
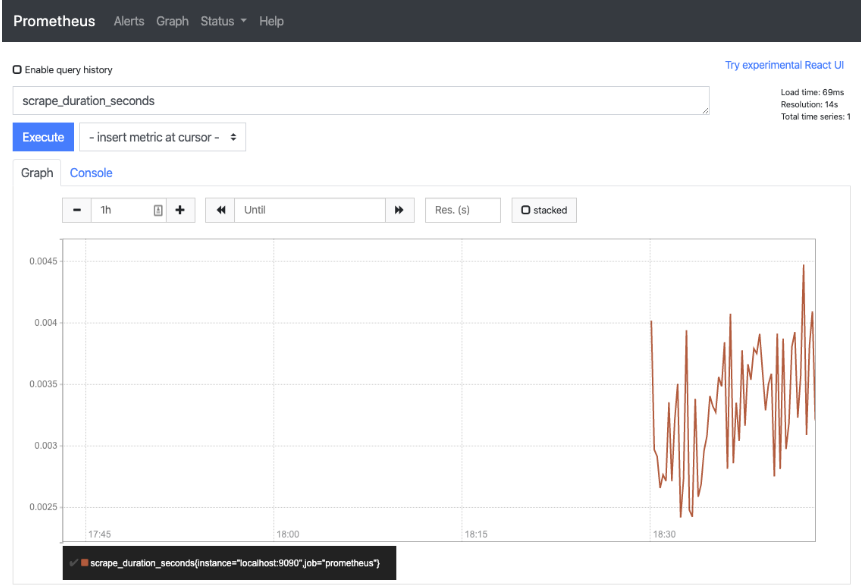
Once you have Prometheus loaded, you can start to use PromQL to do a few searches. The system currently only has one metric source, about itself. This is where a query to see what the process looks like can be done. In the search box enter the query scrape_duration_seconds and click Execute. A response is given back in text form that has an Element and a Value to it.
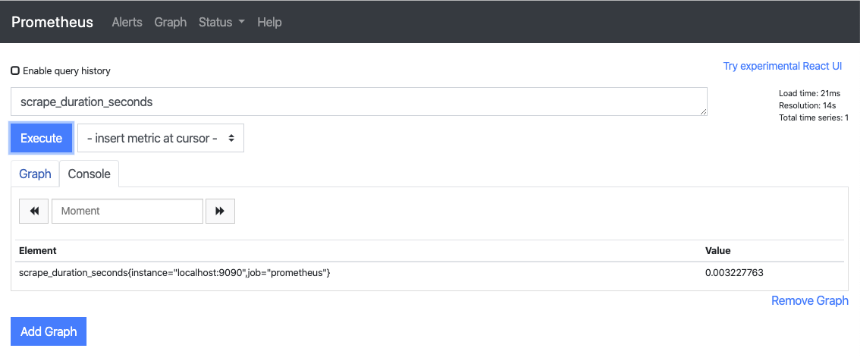
When changing to view the graph of these queries you start to see what may be possible within this time series DB.
Now the configuration will get updated to poll two hosts that have SNMP working on it. You see that the http:// and /metrics portions are removed. If not supplied these are applied by default. The prometheus_config.yml file will now look like below:
global:
  scrape_interval: 15s

scrape_configs:
  - job_name: 'prometheus'
    scrape_interval: 5s
    static_configs:
      - targets: ['localhost:9090']

  - job_name: 'snmp'
    scrape_interval: 60s
    static_configs:
      - targets:
        - 'jumphost.create2020.ntc.cloud.tesuto.com:9012'
        - 'jumphost.create2020.ntc.cloud.tesuto.com:9001'
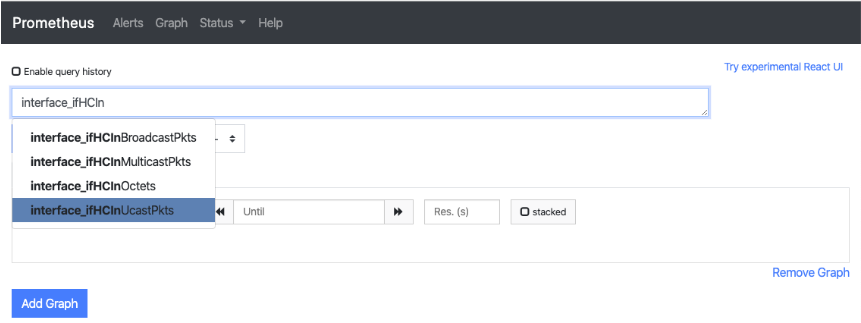
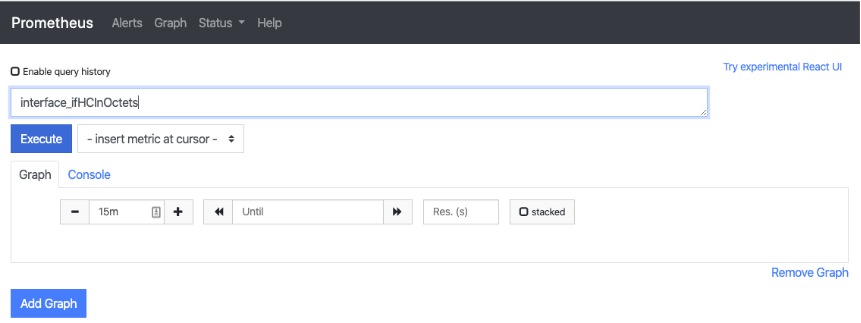
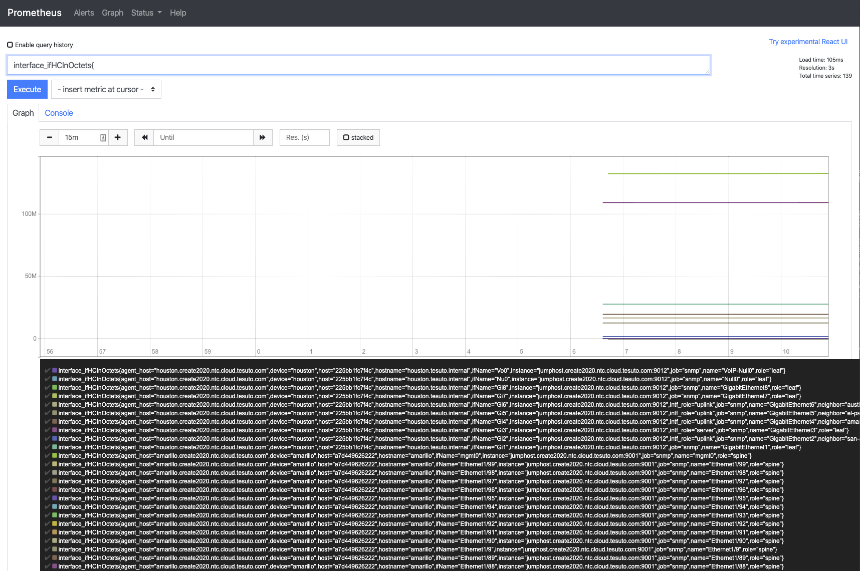
After updating the Prometheus configuration and starting the Prometheus server you can now start to get SNMP data into the graph form. Now updating the PromQL to query for interface_ifHCInOctets you can start to see what the data is that Prometheus is getting from the SNMP data that Telegraf is presenting.
This is all nice, but it is hardly a system that will have a lot of graphs and be something to present to others. This is the role that Grafana will play as a graphing engine.
sudo apt-get install -y adduser libfontconfig1
wget https://dl.grafana.com/oss/release/grafana_6.6.2_amd64.deb
sudo dpkg -i grafana_6.6.2_amd64.deb
josh@prometheus_demo:~$ wget https://dl.grafana.com/oss/release/grafana_6.6.2_amd64.deb
josh@prometheus_demo:~$ wget https://dl.grafana.com/oss/release/grafana_6.6.2_amd64.deb
--2020-03-15 19:21:08--  https://dl.grafana.com/oss/release/grafana_6.6.2_amd64.deb
Resolving dl.grafana.com (dl.grafana.com)... 2a04:4e42:3b::729, 151.101.250.217
Connecting to dl.grafana.com (dl.grafana.com)|2a04:4e42:3b::729|:443... connected.
HTTP request sent, awaiting response... 200 OK
Length: 63232320 (60M) [application/x-debian-package]
Saving to: ‘grafana_6.6.2_amd64.deb’

grafana_6.6.2_amd64.deb                     100%[==========================================================================================>]  60.30M  19.8MB/s    in 3.1s

2020-03-15 19:21:12 (19.8 MB/s) - ‘grafana_6.6.2_amd64.deb’ saved [63232320/63232320]

josh@prometheus_demo:~$ sudo dpkg -i grafana_6.6.2_amd64.deb
Selecting previously unselected package grafana.
(Reading database ... 67127 files and directories currently installed.)
Preparing to unpack grafana_6.6.2_amd64.deb ...
Unpacking grafana (6.6.2) ...
Setting up grafana (6.6.2) ...
Adding system user `grafana' (UID 111) ...
Adding new user `grafana' (UID 111) with group `grafana' ...
Not creating home directory `/usr/share/grafana'.
### NOT starting on installation, please execute the following statements to configure grafana to start automatically using systemd
 sudo /bin/systemctl daemon-reload
 sudo /bin/systemctl enable grafana-server
### You can start grafana-server by executing
 sudo /bin/systemctl start grafana-server
Processing triggers for systemd (237-3ubuntu10.39) ...
Processing triggers for ureadahead (0.100.0-21) ...
 sudo /bin/systemctl daemon-reload
 sudo /bin/systemctl enable grafana-server
 sudo /bin/systemctl start grafana-server
josh@prometheus_demo:~$ sudo /bin/systemctl daemon-reload
josh@prometheus_demo:~$ sudo systemctl enable grafana-server
Synchronizing state of grafana-server.service with SysV service script with /lib/systemd/systemd-sysv-install.
Executing: /lib/systemd/systemd-sysv-install enable grafana-server
Created symlink /etc/systemd/system/multi-user.target.wants/grafana-server.service → /usr/lib/systemd/system/grafana-server.service.
josh@prometheus_demo:~$ sudo systemctl start grafana-server
I like to verify that Grafana is in fact running by checking for the listening ports. You can do this by using the ss -lt command to get the output, and checking that there is a *:3000 entry in the output. TCP/3000 is the default port for Grafana.
josh@prometheus_demo:~$ ss -lt
State                 Recv-Q                 Send-Q                                   Local Address:Port                                     Peer Address:Port
LISTEN                0                      128                                      127.0.0.53%lo:domain                                        0.0.0.0:*
LISTEN                0                      128                                            0.0.0.0:ssh                                           0.0.0.0:*
LISTEN                0                      128                                               [::]:ssh                                              [::]:*
LISTEN                0                      128                                                  *:3000                                                *:*
The default login is admin/admin. When you first log in you will be prompted for a new admin password.


Before you add in additional data sources that are needed, you need to restart the service on your Linux host.
josh@prometheus_demo:~$ ./prometheus --config.file=prometheus_config.yml
Now that you are in you need to add a data source for Grafana. In this demo you are going to see us add a localhost connection to Prometheus. Going back to the web interface on the main menu that you started into you can click on Add datasource.

In this instance of 6.6.x Grafana had Prometheus on the top of the list. Navigate to where you see Prometheus and click select.

The data source will bring you to a configuration screen.
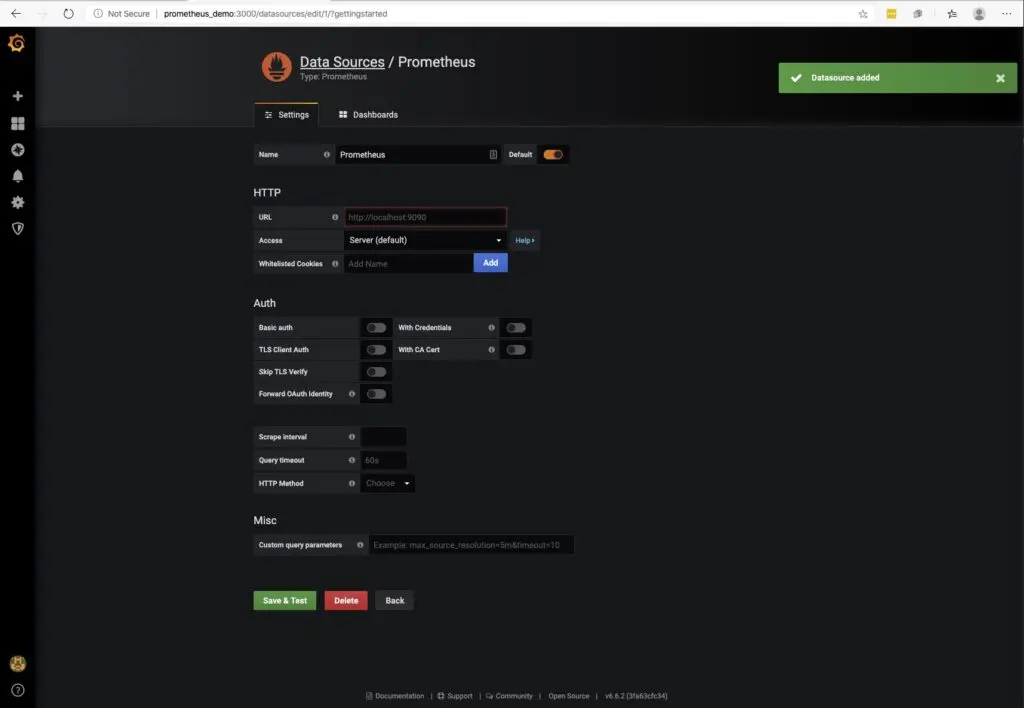
Here make the following changes:
| Field | Setting |
|---|---|
| URL | http://localhost:9090 |
Once modified, click Save and Test to test and verify connectivity to the DB. If you setup a different host as the Prometheus server, then you would enter the hostname/IP address combination that corresponds to the Prometheus host.

When you get the message Data source is working you have successfully connected.
Now navigate to the left hand navigation and select the plus icon, select Dashboard to get a new dashboard created.


You get a new panel page, and then select Add Query.
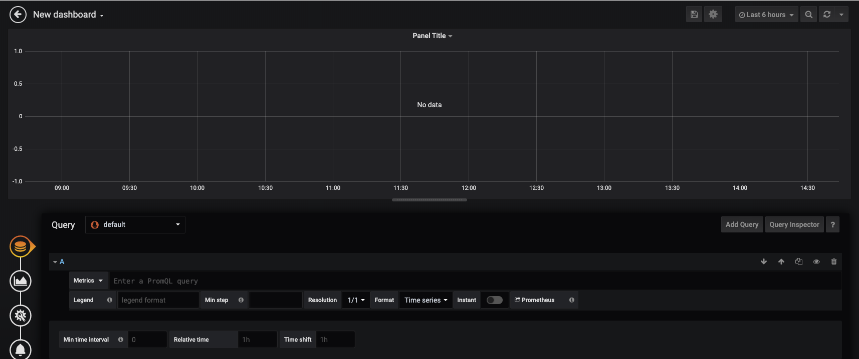
Once on the new query page we will set a search to get the Inbound utilization on an interface. Set up the query as follows:
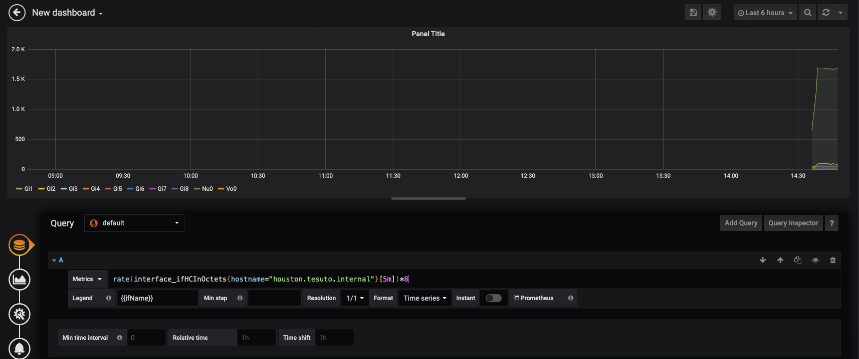
Note that the queries used on this Grafana example are going to be of PromQL – the Prometheus Query Langague. In this graphic, the {{ifName}} is telling Grafana that ifName is the variable to lookup to add to the legend for each measurement.
If your data source for Grafana is Graphite or InfluxDB, you would use the same query language used by the database system of the data source.
To explain what each item is doing to help generate your own queries. Given the following PromQL query:
rate(interface_ifHCInOctets{hostname="houston.tesuto.internal"}[2m])*8
The rate query from Prometheus covers the rate of change. With SNMP, the number gathered for Interface utilization is an increasing number, not a rate. So the Prometheus system needs to calculate what that rate is. The [2m] indicates to calculate the per-second rate measured over the past 2 minutes.
The metric name in the query is interface_ifHCInOctets. This is the metric that was taken a look at earlier in the post. This is the exact measurement.
The tags in the search is to help filter out what is being searched upon to give the proper graph. In this instance you will only see interfaces on the device hostname houston.tesuto.internal.
In the query there is a *8 at the end. This is to convert the measurement from octets as defined in the metric over to bits. An octet is 8 bits, thus the multiplication by 8.
Now we’re going to make a few more updates on the graph. Here are the changes being made on the Visualization section (2nd of four items on the left hand side of the panel configuration). Specifically, the changes being made are in the Axis subsection. You can play around with settings in the upper section to get some changes made to the graphs.
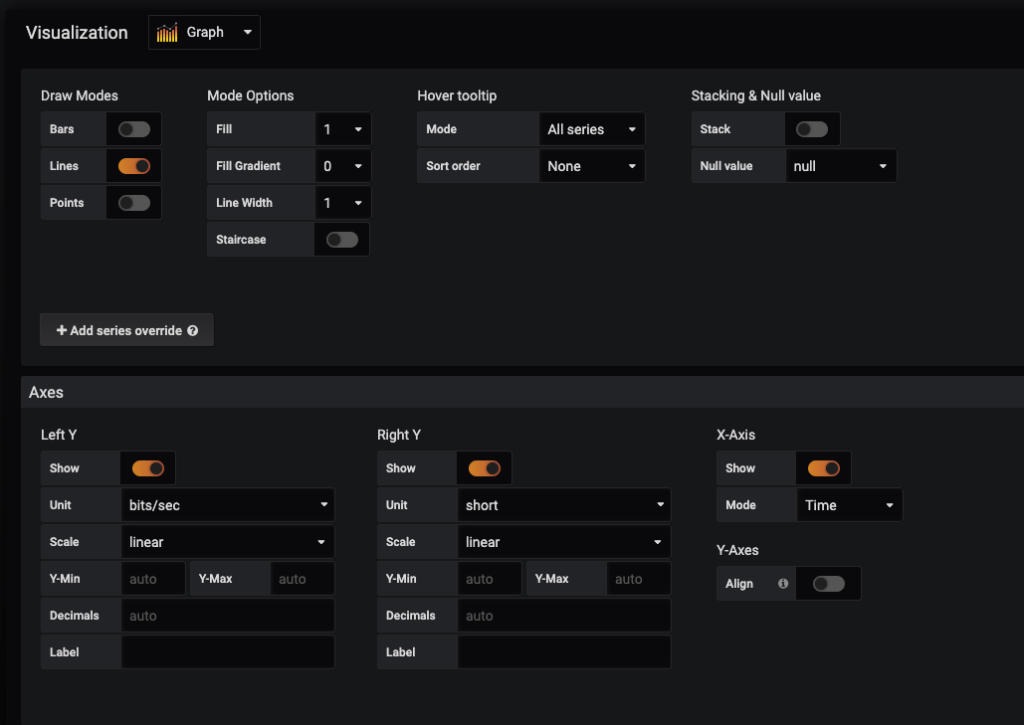

| Setting | Modification |
|---|---|
| Left Y: Unit | bits/sec (under Data Rate) |
| Legend Values: Min | Checked |
| Legend Values: Avg | Checked |
| As Table | Checked |
| To Right | Checked |
Here is where you can set the title of the panel. Let’s change that to Houston Interface Utilization. After making the update, click on the upper left to go back to the dashboard.
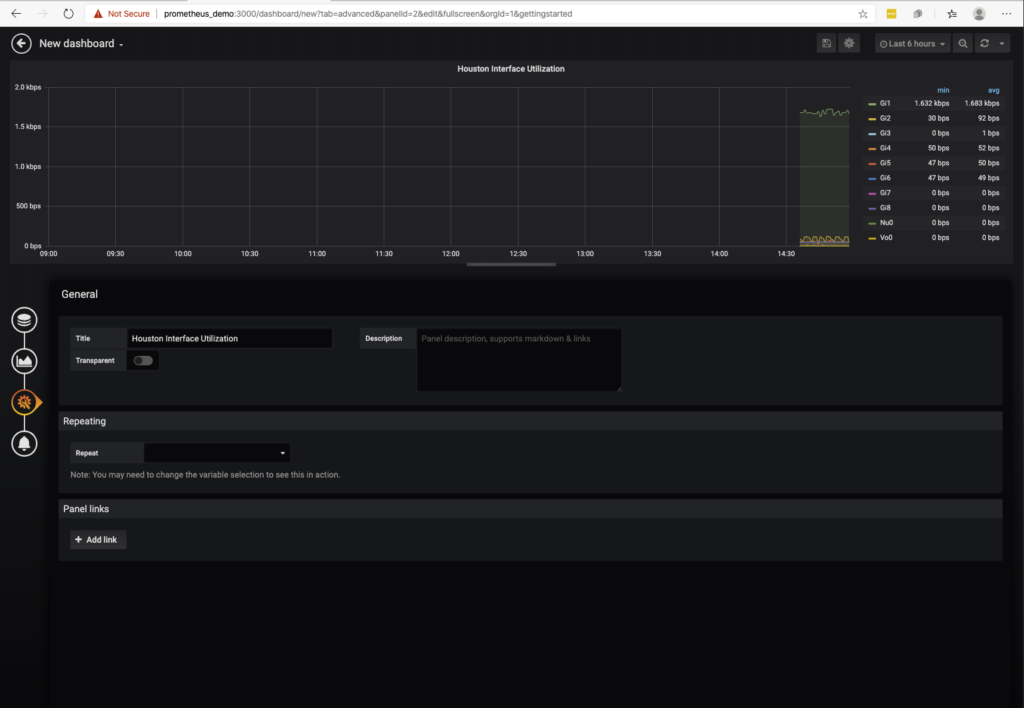
The panel size can be adjusted in size by dragging the corners as you see fit to make your dashboard.
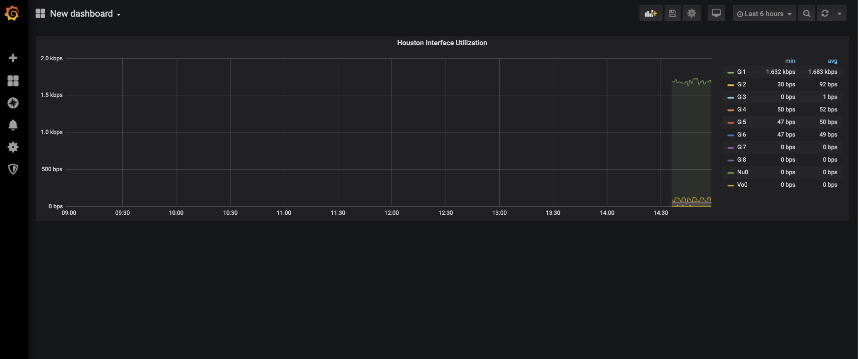
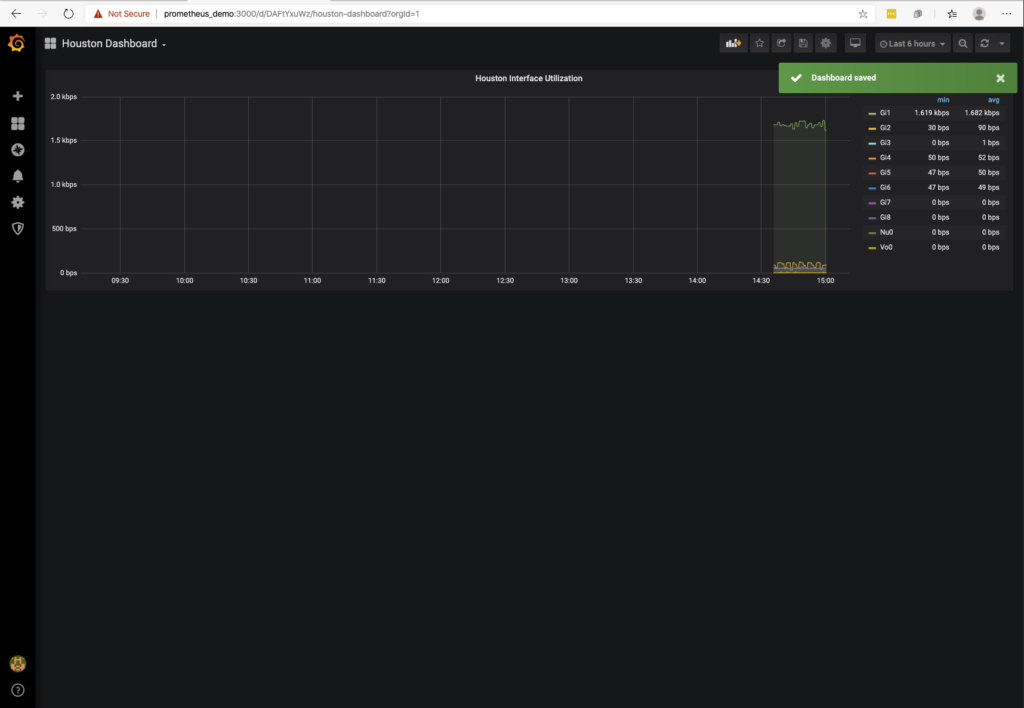
On the main dashboard page to change the name on the dashboard select the Save icon on the upper right. This will give you a prompt with a New Name and Folder to save the dashboard into. This allows you to add heirarchy to your dashboarding system.

Important Note – if you make changes you do need to save the changes. Grafana as of this version does not save changes after a change. It does require you to save your changes once you are done making changes.
After you save the changes you get a visual confirmation that the changes are saved and that you now have a title on dashboard!
Hopefully this will help on your journey! In a follow-up post I will take a look at a few more capabilities within Telegraf, Prometheus, and Grafana.
To continue on in the journey, take a look at Network Telemetry – Advancing Your Dashboards and monitoring websites.
-Josh
Share details about yourself & someone from our team will reach out to you ASAP!