In network service delivery, the network exists to have applications ride on it. Yes, even voice is considered an application when it is riding over the top of the network. We have explored in previous posts how to get telemetry data from your network devices to get an understanding of how they are performing from a device perspective. Now, in this post, I will move on to exploring how to monitor web applications and DNS using Telegraf, Prometheus, and Grafana. Often your operations teams will receive reports of websites not working for a user or you are just looking to get some more visibility into your own web services. The following method could be used to get more insight into the network and the name resolution required for those applications.
There are also several other Telegraf inputs available including ping (ICMP) and TCP tests. As of this post in May 2020 there are 181 different input plugins available to choose from. Take a look at the Telegraf plugins for more details and explore what other plugins you may be able to use to monitor your environment.
I will not be going into the setup of these tools, as this is already covered in a previous post. The previous posts in the series are:
These posts can help you get up and running when it comes to monitoring your network devices in CLI, SNMP, and gNMI.
Blackbox exporter from Prometheus is also a valid choice for this process, and I encourage you to try both the Telegraf and Blackbox exporters in your environment.

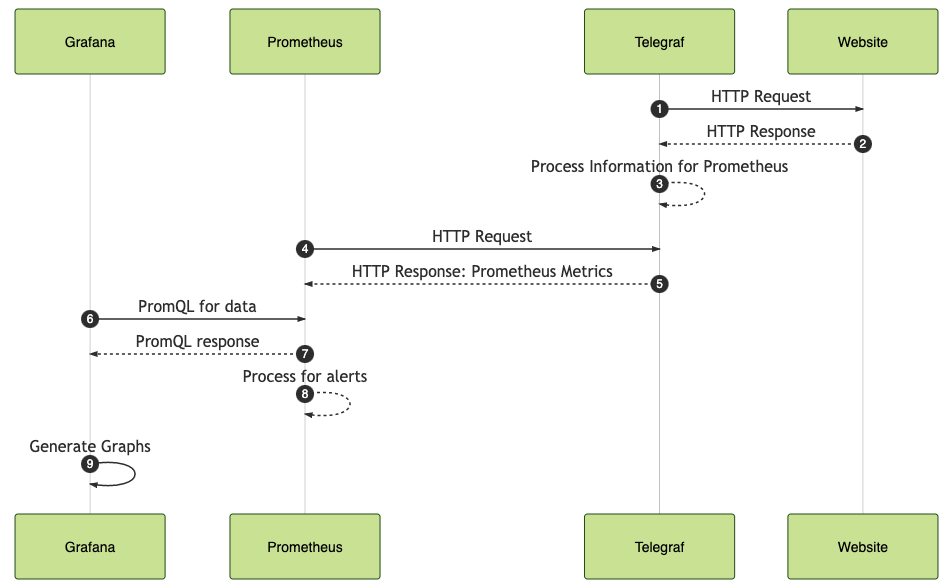
Telegraf has the HTTP Response plugin that does exactly what we would be looking to use for gathering metrics about a HTTP response. This lets you define the list of websites that you wish to monitor, set options for proxy, response timeout, method, any data you may want to include in the body, and various responses. Take a look at the plugin documentation for more details. Here is the configuration that is going to get setup for this demonstration:
#####################################################
#
# Check on status of URLs
#
#####################################################
[[inputs.http_response]]
  urls = ["https://www.networktocode.com", "https://blog.networktocode.com", "https://www.service-now.com"]
  method = "GET"
  follow_redirects = true

#####################################################
#
# Export Information to Prometheus
#
#####################################################
[[outputs.prometheus_client]]
  listen = ":9012"
  metric_version = 2
Upon executing this, here are the relevant Prometheus metrics that we are gathering:
# HELP http_response_content_length Telegraf collected metric
# TYPE http_response_content_length untyped
http_response_content_length{method="GET",result="success",result_type="success",server="https://blog.networktocode.com",status_code="200"} 1.791348e+06
http_response_content_length{method="GET",result="success",result_type="success",server="https://www.networktocode.com",status_code="200"} 123667
http_response_content_length{method="GET",result="success",result_type="success",server="https://www.service-now.com",status_code="200"} 478636
# HELP http_response_http_response_code Telegraf collected metric
# TYPE http_response_http_response_code untyped
http_response_http_response_code{method="GET",result="success",result_type="success",server="https://blog.networktocode.com",status_code="200"} 200
http_response_http_response_code{method="GET",result="success",result_type="success",server="https://www.networktocode.com",status_code="200"} 200
http_response_http_response_code{method="GET",result="success",result_type="success",server="https://www.service-now.com",status_code="200"} 200
# HELP http_response_response_time Telegraf collected metric
# TYPE http_response_response_time untyped
http_response_response_time{method="GET",result="success",result_type="success",server="https://blog.networktocode.com",status_code="200"} 0.371015121
http_response_response_time{method="GET",result="success",result_type="success",server="https://www.networktocode.com",status_code="200"} 0.186775794
http_response_response_time{method="GET",result="success",result_type="success",server="https://www.service-now.com",status_code="200"} 0.658694795
# HELP http_response_result_code Telegraf collected metric
# TYPE http_response_result_code untyped
http_response_result_code{method="GET",result="success",result_type="success",server="https://blog.networktocode.com",status_code="200"} 0
http_response_result_code{method="GET",result="success",result_type="success",server="https://www.networktocode.com",status_code="200"} 0
http_response_result_code{method="GET",result="success",result_type="success",server="https://www.service-now.com",status_code="200"} 0
You have several pieces that come back right away including:

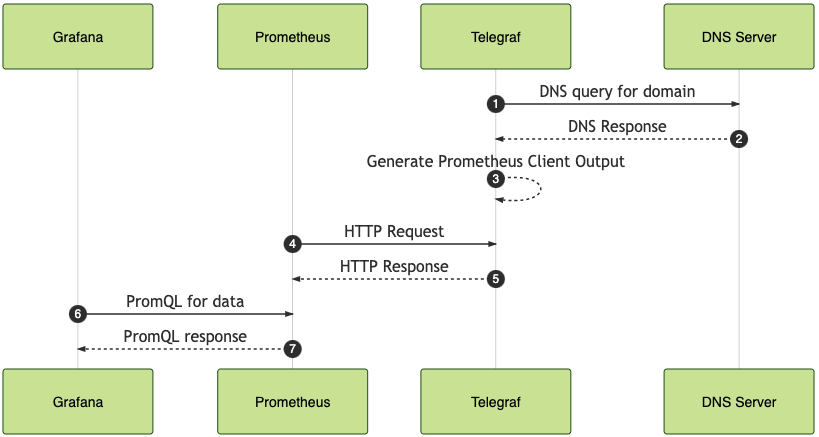
On top of this, I want to also show how to add in a second input. We will add in a DNS query to test the name resolution of the sites as well to verify that the DNS lookup is working as expected. This could also be extended to test and verify DNS from a user perspective within your environment.
#####################################################
#
# Check on status of URLs
#
#####################################################
[[inputs.http_response]]
  urls = ["https://www.networktocode.com", "https://blog.networktocode.com", "https://www.service-now.com"]
  method = "GET"
  follow_redirects = true

[[inputs.dns_query]]
  servers = ["8.8.8.8"]
  domains = ["blog.networktocode.com", "www.networktocode.com", "www.servicenow.com"]

#####################################################
#
# Export Information to Prometheus
#
#####################################################
[[outputs.prometheus_client]]
  listen = ":9012"
  metric_version = 2
The new section is:
[[inputs.dns_query]]
  servers = ["8.8.8.8"]
  domains = ["blog.networktocode.com", "www.networktocode.com", "www.servicenow.com"]
Based on the plugin definition we are going to define to use the Google DNS resolver. And the interesting domains that we are going to verify are blog.networktocode.com, www.networktocode.com, and the popular ITSM tool ServiceNow.
Here is what gets added to the Prometheus Client output:
# HELP dns_query_query_time_ms Telegraf collected metric
# TYPE dns_query_query_time_ms untyped
dns_query_query_time_ms{domain="blog.networktocode.com",rcode="NOERROR",record_type="NS",result="success",server="8.8.8.8"} 70.950858
dns_query_query_time_ms{domain="www.networktocode.com",rcode="NOERROR",record_type="NS",result="success",server="8.8.8.8"} 48.118903
dns_query_query_time_ms{domain="www.servicenow.com",rcode="NOERROR",record_type="NS",result="success",server="8.8.8.8"} 48.552328
# HELP dns_query_rcode_value Telegraf collected metric
# TYPE dns_query_rcode_value untyped
dns_query_rcode_value{domain="blog.networktocode.com",rcode="NOERROR",record_type="NS",result="success",server="8.8.8.8"} 0
dns_query_rcode_value{domain="www.networktocode.com",rcode="NOERROR",record_type="NS",result="success",server="8.8.8.8"} 0
dns_query_rcode_value{domain="www.servicenow.com",rcode="NOERROR",record_type="NS",result="success",server="8.8.8.8"} 0
# HELP dns_query_result_code Telegraf collected metric
# TYPE dns_query_result_code untyped
dns_query_result_code{domain="blog.networktocode.com",rcode="NOERROR",record_type="NS",result="success",server="8.8.8.8"} 0
dns_query_result_code{domain="www.networktocode.com",rcode="NOERROR",record_type="NS",result="success",server="8.8.8.8"} 0
dns_query_result_code{domain="www.servicenow.com",rcode="NOERROR",record_type="NS",result="success",server="8.8.8.8"} 0
The corresponding values gathered from the dns_query input are:
The configuration for Prometheus at this point has a single addition to gather the statistics for each of the websites:
global:
  scrape_interval: 15s

scrape_configs:
  - job_name: 'prometheus'
    scrape_interval: 5s
    static_configs:
      - targets: ['localhost:9090']

  - job_name: 'telegraf website'
    scrape_interval: 10s
    static_configs:
      - targets:
        - "localhost:9012"
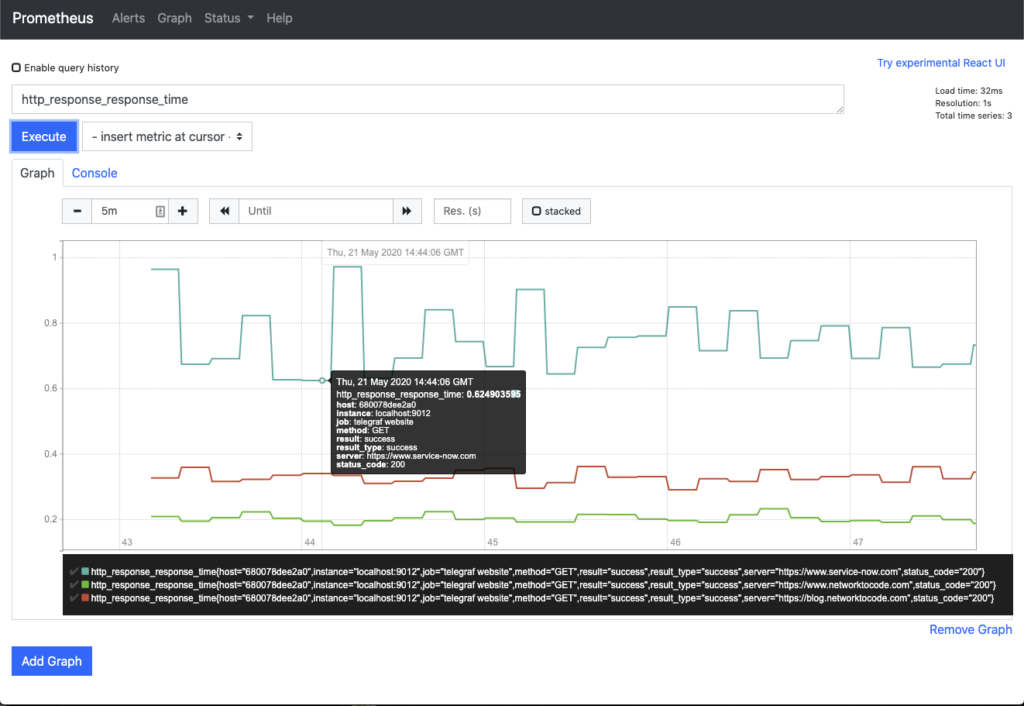
When you navigate to the base page to check on how Prometheus is doing with polling the data you can get a base graph. Here you see that all three sites are appearing on the graph with respect to response time:

What does it look like to get this information into a graph on Grafana?

To build this chart, this is a small configuration. In the Metrics section I only put the query of http_response_response_time. With the legend I set it to {{ server }} to get the website address as the table legend.
In the visualization section, the only thing that is needs to be doneis to adjust in the Left Y Axis Unit to be seconds (s) to provide the proper Y-Axis Metric.

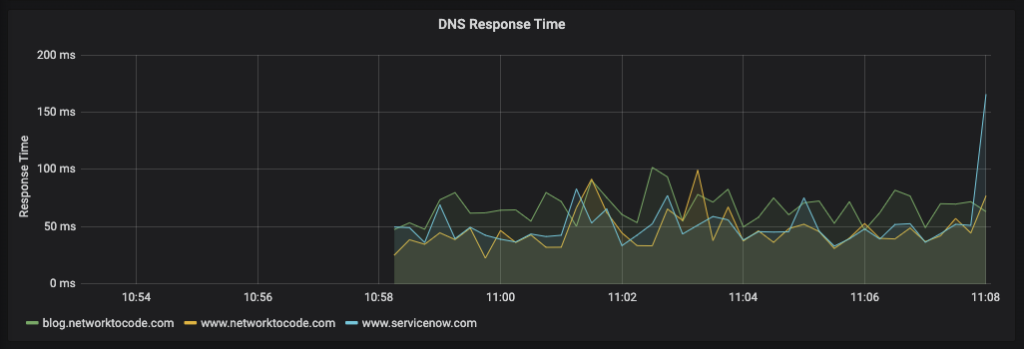
This is going to be another small configuration panel, similar to the previous one. In the Metrics section the corresponding query to get response time is dns_query_query_time_ms. The legend you then set to {{ domain }} to match that of what is in the query shown above.
In the visualization section, you should use the Unit of milliseconds (ms). If you copied the panel from the Website panel, don’t forget to change this. The unit of measure is in fact different and the time scale would be off.
Hopefully this post will help you gain some insight into your environment. We have been using this process internally at Network to Code already, keeping an eye on our key services that we rely on to understand if there is an individual issue or an issue with the service. Let us know your thoughts and comments! To continue the conversation, check out the #Telemetry channel inside the Network to Code Slack. Sign up at slack.networktocode.com.
-Josh
Share details about yourself & someone from our team will reach out to you ASAP!