Time series databases and their query languages are tools with increasing popularity for a Network Automation Engineer. However, sometimes these tools may be overlooked by network operators for more “pressing” day-to-day workflow automation. Time series databases offer valuable network telemetry that will reveal important insights for network operations, such as security breaches, network outages, and slowdowns that degrade the user experience.
In this post, we will review the Prometheus Query Language (PromQL) to demonstrate the value and capabilities of processing time series. This review will offer use cases of PromQL for network engineers and data scientists.
Prometheus is an open source systems monitoring and alerting toolkit. As you can see in the figure below, the heart of Prometheus includes a Time Series Database (TSDB) and the PromQL Engine. Exporters run locally on monitored hosts and export local metrics related to device health, such as CPU and memory utilization, and services, such as HTTP. The alert mechanism implemented with Prometheus, triggers alerts based on events and predefined thresholds. Prometheus has a web UI that we will be using in the examples of this post. In addition, the Prometheus measurements can be visualized using Grafana dashboards.
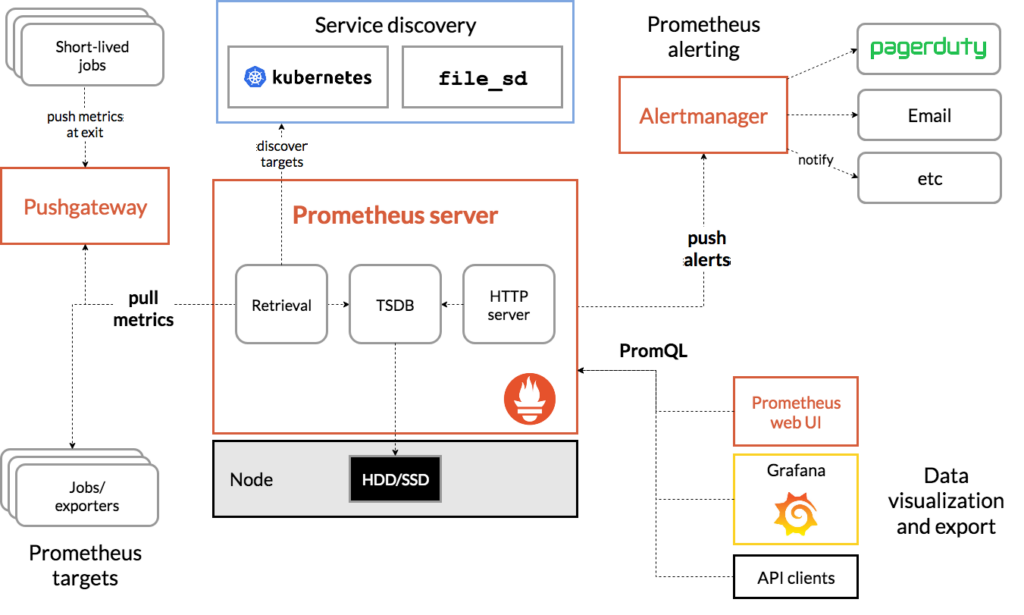
Source: Prometheus Overview
In simple words, it is a database that stores time series. Then, what is a time series? It is a set of time-stamps and their corresponding data. A TSDB is optimized to store these time series data efficiently, measure changes, and perform calculations over time. PromQL is the language that was built to retrieve data from the Prometheus TSDB. In networking, this could mean tracking the state of an interface or bandwidth utilization over time.
There are several other TSDBs, one of the most well known is InfluxDB. Both Prometheus TSDB and InfluxDB are excellent tools for telemetry and time series data manipulation. PromQL’s popularity has been growing fast because it is a comprehensive language to consume time series data. Multiple other solutions are starting to support PromQL, such as NewRelic that recently added support for PromQL and Timescale with Promscale.
Now that we have all the prerequisite knowledge we can dive deep into the PromQL data model and dissect language queries.
The first part of the Prometheus data model is the metric name. A metric name is uniquely identified, and it indicates what is being measured. A metric is a dimension of a specific feature. Labels are the second part of the data model. A label is a key-value pair that differentiates sub-dimensions in a metric.
Think of a metric, ex. interface_in_octets, as an object with multiple characteristics, ex., device_role. As you can see in the figure below, each label can pick a value for this characteristic, i.e. device_role="leaf". The combination of metrics and labels return a time series identifier, i.e., a list of tuples that provide the (timestamp, value) of the object with the specific characteristic. The timestamps are given in Unix time, milliseconds precision and the values that correspond to them are floating point type.
As a Network Automation Engineer you can think of many examples of metrics, such as interface_speed, bgp_hold_time, packets_dropped, etc. All these metrics can be characterized by a variety of labels, such as device_platform, host, instance, interface_name etc.

With that data model in mind, let us next dissect a query in PromQL.
The simplest form of a PromQL query may include just a metric. This query returns multiple single value vectors, as you can see below. All the applicable labels and value combinations that these labels can be assigned are given as a result of this simple query.
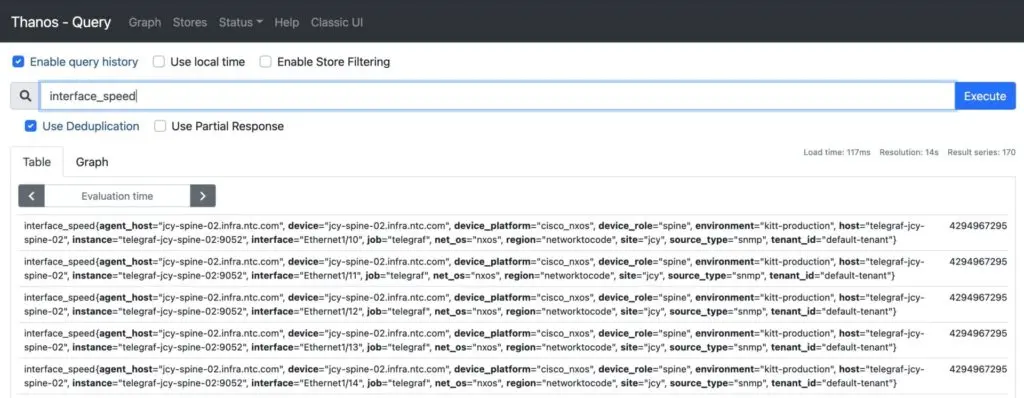
What kind of metrics does PromQL support? There are four kinds of metrics:
Now that we know what kinds of metrics we can include in our query, let us review how we can filter the query to retrieve more specific and meaningful results. This can be done with label filtering that includes the following operations:
# equal, returns interface speed for device with name jcy-bb-01
interface_speed{device="jcy-bb-01.infra.ntc.com"}
# not equal, returns the opposite of the above query
interface_speed{device!="jcy-bb-01.infra.ntc.com"}
# regex-match, matches interface Ethernet{1, 2, 3, 4, 5, 6, 7}
interface_speed{interface=~"Ethernet1/[1-7]"}
# not regex-match, returns the opposite of the above query
interface_speed{interface!~"Ethernet1/[1-7]"}
Not only can you use the equal and not equal signs to filter your queries, but you can filter using regular expressions. To learn more about regular expressions for network engineers, check our previous blog.
One of my favorite parts of PromQL are the functions that can manipulate the time series identifiers. Below, I include an example of the function rate(), that is useful for network metrics, and the function predict_linear(), that is useful if you perform data analytics.
The function rate() can be used with counter metrics to demonstrate how fast a counter increases. Specifically, it calculates the per second increase for a time period. This is a useful function to the network engineer, since counters are a common metric applied in networks. For example packet counting, interface octets counting are counters and the rate() function offers useful insights on how these counters increase.
#per second increase of counter averaged over 5 mins
rate(interface_in_octets{device_role="leaf"}[5m])
The next figure will help you understand the details of how the rate() function is calculated. The interval $\Delta$t indicates the time interval during which we want to calculate the rate. The X marks indicate the per second samples that are used to calculate multiple rates per second. The rate() function averages these calculations during the interval $\Delta$t. If the counter is reset to 0, the rate() function will extrapolate the sample as can be seen with the blue X marks.
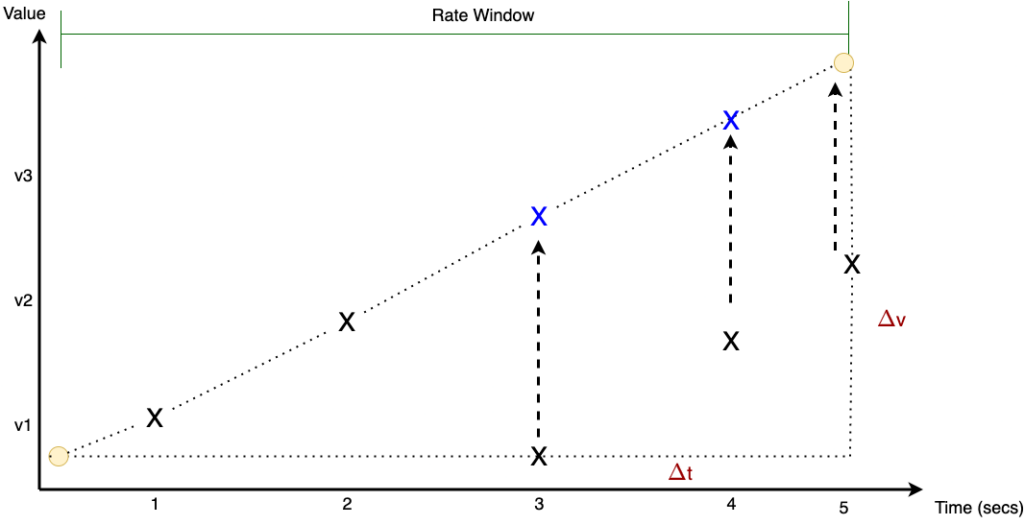
You probably have noticed that the example of the rate() function above, uses a different type of syntax. Specifically it identifies the time series during an interval, from the example above the interval is 5 minutes ([5m]). This results to a range vector, where the time-series identifier returns the values for a given period, in this case 5 minutes. On the other hand, an instance vector returns one value, specifically the single latest value of a time series. The figures below shows the differences in the results of an instance vector versus a range vector.
#instance vector
interface_speed{device="jcy-bb-01.infra.ntc.com"}
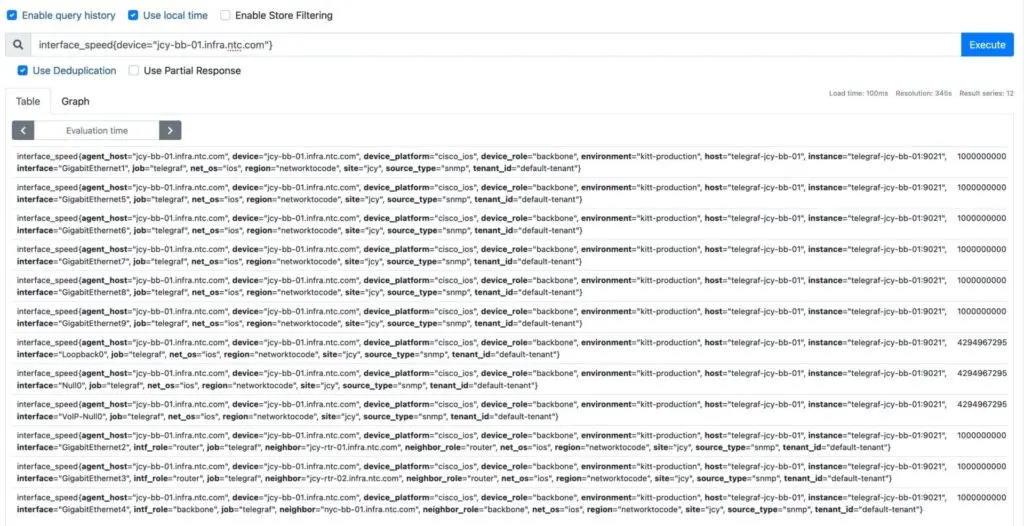
#range vector
interface_speed{device="jcy-bb-01.infra.ntc.com"}[5m]

In the first figure, only one value per vector is returned whereas in the second, multiple values that span in the range of 5 minutes are returned for each vector. The format of these values is: value@timestamp.
You may be wondering: all of this is great, but where is the “time” in my “time-series”? The offset part of the query can retrieve data for a specific time interval. For example:
# interface speed status for the past 24 hrs
rate(interface_in_octets{device="jcy-bb-01.infra.ntc.com"}[5m] offset 24h)
Here we combine the function rate(), that samples the interface_in_octets counter every second for five minutes, with offset that gives us historical data for the past 24 hours.
Of course! PromQL provides the function predict_linear(), a simple machine learning model that predicts the value of a gauge in a given amount of time in the future, by using linear regression. This function is of more interest to a data scientist that wants to create forecasting models. For example, if you want to predict the disk usage in bytes within the next hour based on historic data, you would use the following query:
#predict disk usage bytes in an hour, using the last 15 mins of data
predict_linear(demo_disk_usage_bytes{job="demo"}[15m], 3600)
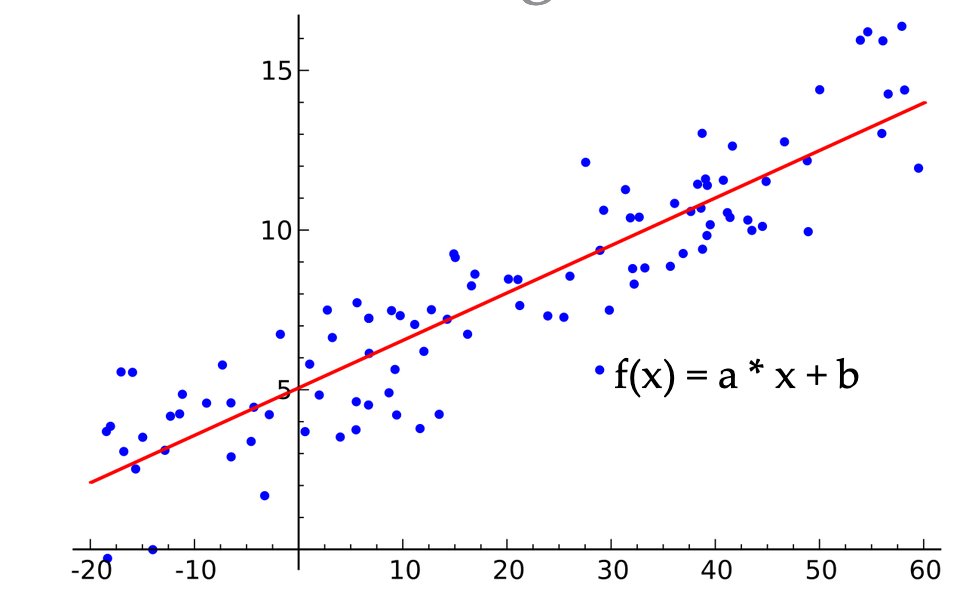
Linear regression fits a linear function to a set of random data points. This is achieved by searching for all possible values for the variables a, b that define a linear function f(x)=ax+b. The line that minimizes the mean Euclidean distance of all these data points is the result of the linear regression model, as you can see in the image below:
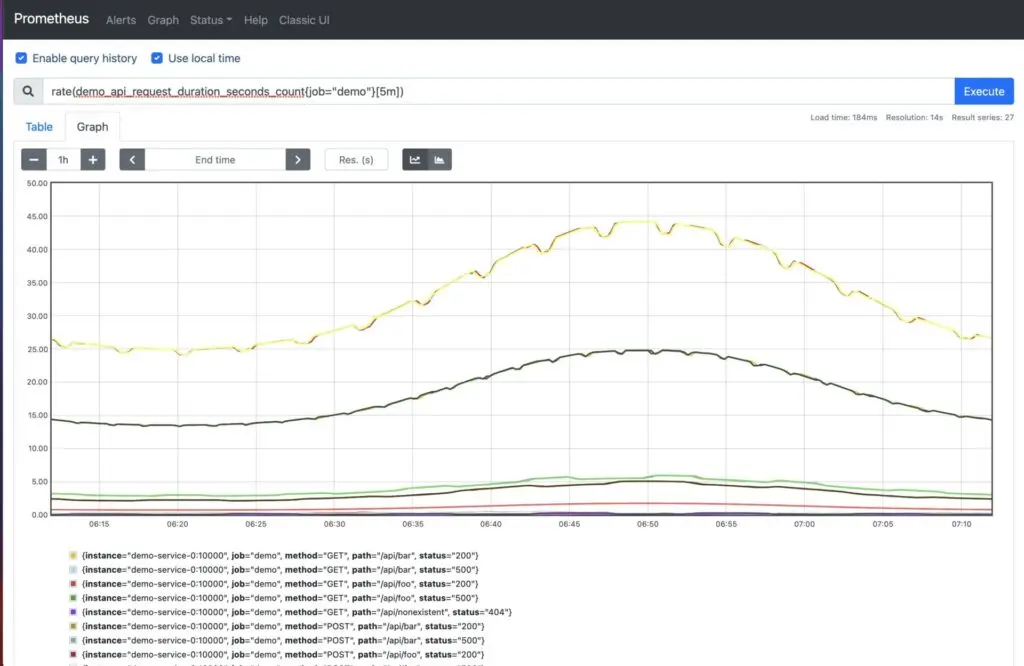
PromQL queries can be highly dimensional. This means that one query can return a set of time series identifiers for all the combinations of labels, as you can see below:
#multi-dimensional query
rate(demo_api_request_duration_seconds_count{job="demo"}[5m])
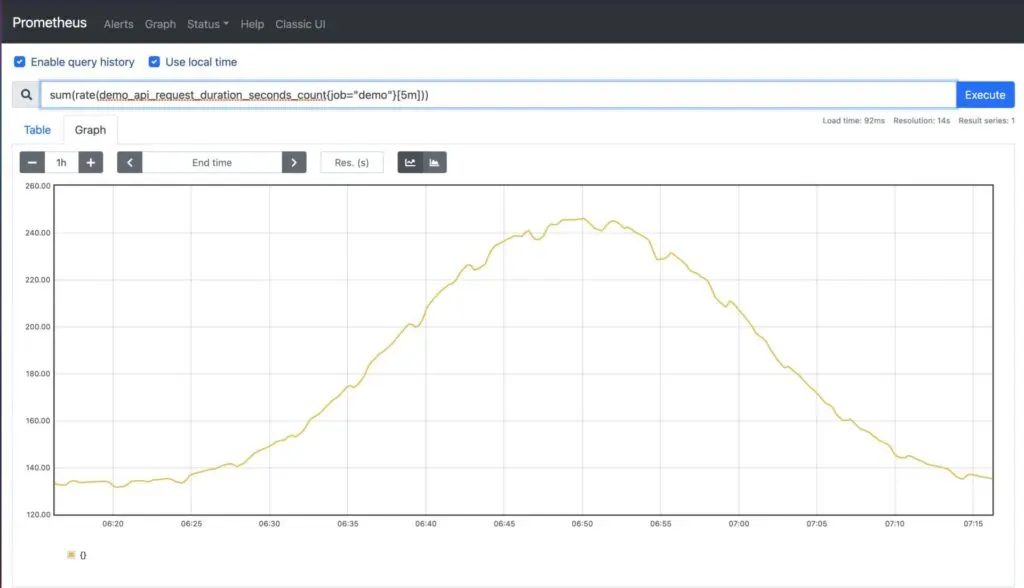
What if you want to reduce the dimensions to a more meaningful result, for example the sum of all the API request durations in seconds? This would result in a single-dimension query that is the result of adding multiple instance vectors together:
#one-dimensional query, add instance vectors
sum(rate(demo_api_request_duration_seconds_count{job="demo"}[5m]))
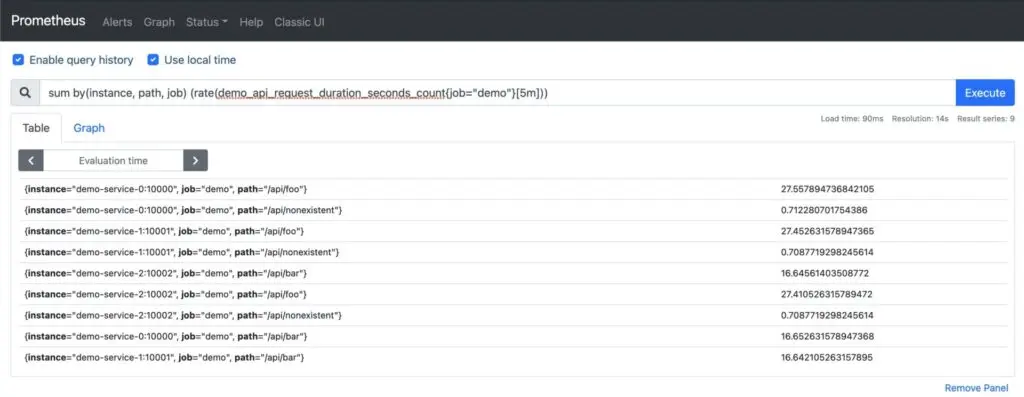
You may choose to aggregate over specific dimensions using labels and the function by(). In the example below, we perform a sum over all instances, paths, and jobs. Note the reduction of the number of vectors returned:
# multi-dimensional query - by()
sum by(instance, path, job) (rate(demo_api_request_duration_seconds_count{job="demo"}[5m]))
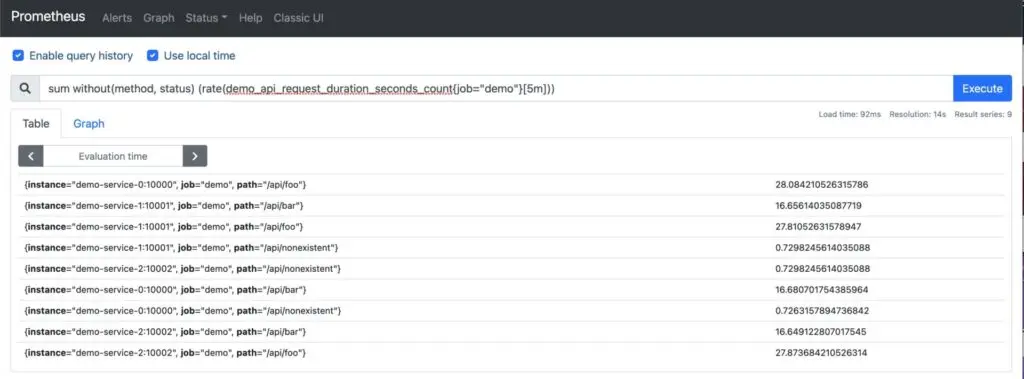
We can perform the same query excluding labels using the function without():
sum without(method, status) (rate(demo_api_request_duration_seconds_count{job="demo"}[5m]))
This results to the same set of instance vectors:
Additional aggregation over dimensions can be done with the following functions:
min(): selects the minimum of all values within an aggregated group.max(): selects the maximum of all values within an aggregated group.avg(): calculates the average (arithmetic mean) of all values within an aggregated group.stddev(): calculates the standard deviation of all values within an aggregated group.stdvar(): calculates the standard variance of all values within an aggregated group.count(): calculates the total number of series within an aggregated group.count_values(): calculates number of elements with the same sample value.Thank you for taking this journey with me, learning about the time series query language, PromQL. There are many more features to this language such as arithmetic, sorting, set functions etc. I hope that this post has given you the opportunity to understand the basics of PromQL, see the value of telemetry and TSDBs, and that it has increased your curiosity to learn more.
-Xenia
Share details about yourself & someone from our team will reach out to you ASAP!