Over the past several posts, I have discussed how to gather metrics about your infrastructure and web applications. Now, the natural progression is to move into alerting with Prometheus. This post will build on the previous post on gathering website and DNS responses. I will be taking you through how to setup a rule whenever a website gives a response other than a 200 OK response. To accomplish this we will take a look at the metric http_response_http_response_code gathered via Telegraf.
You configure rules in files and reference those file names within the Prometheus configuration. A common practice is to name the file alert.rules within the /etc/prometheus/ directory.
The following outlines what the file will contain. The alert rules will be defined by a YAML file that specifies the alert name (alert), expression (expr) to search for within Prometheus, and the time (for) that the event status meets the criteria. There are additional keys available as well, such as labels and annotations as demonstrated below:
groups:
- name: websites
  rules:
  - alert: WebsiteDown
    expr: http_response_http_response_code != 200
    for: 1m
    labels:
      severity: critical
    annotations:
      summary: "{{ $labels.instance }} is not responding with 200 OK."
This is what the configuration will look like for the prometheus.yml file. The rules file that is created above will be added to the array under the key rule_files. This will allow for multiple files to be processed by Prometheus.
global:
  scrape_interval: 15s

rule_files:
  - alert.rules

alerting:
  alertmanagers:
  - static_configs:
    - targets:
      - localhost:9093

scrape_configs:
  - job_name: 'prometheus'
    scrape_interval: 5s
    static_configs:
      - targets: ['localhost:9090']

  - job_name: 'telegraf website'
    scrape_interval: 10s
    static_configs:
      - targets:
        - "localhost:9012"
Once the rules are loaded, you can verify the rules by going to the Prometheus url – http://<hostname_or_ip>:9090/rules. You will now see what rules are loaded:
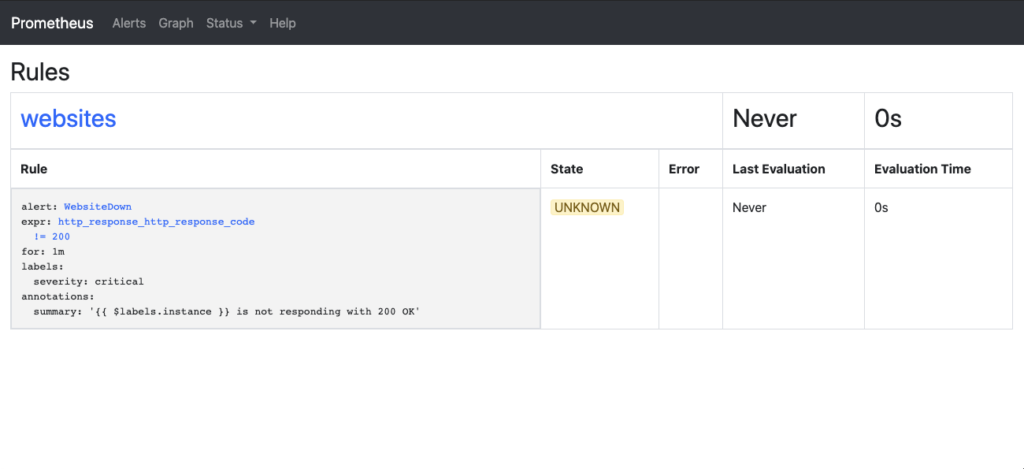
Now you have a configuration for the alerts, but how do you actually manage them? You’ll need to add an application into the environment, Prometheus AlertManager. AlertManager is where you will handle the silencing, deduplicating, grouping, and routing of alerts to the appropriate outputs. These destinations can include, but not limited to, Slack, email, or webhooks. The AlertManager configuration page has the details on how to make configuration for these:
Installation can be done in several ways. There are binaries available for many common platforms, Docker containers, and installation from source. In this demo, I will just be installing the binary via the installation using wget to download the file.
Once the file is downloaded, we will expand it within the directory:
tar -xzf alertmanager-0.20.0.linux-amd64.tar.gz
The AlertManager configuration is to be handled in the alertmanager.yml file. An example may look like:
route:
  group_by: [Alertname]
  # Send all notifications to me.
  receiver: email-me

receivers:
- name: email-me
  email_configs:
  - to: $GMAIL_ACCOUNT
    from: $GMAIL_ACCOUNT
    smarthost: smtp.gmail.com:587
    auth_username: "$GMAIL_ACCOUNT"
    auth_identity: "$GMAIL_ACCOUNT"
    auth_password: "$GMAIL_AUTH_TOKEN"
To start this test instance of AlertManager the command ./alertmanager --config.file="alertmanager.yml" is executed to start AlertManager:
$ ./alertmanager --config.file="alertmanager.yml"
level=info ts=2020-05-21T15:14:56.850Z caller=main.go:231 msg="Starting Alertmanager" version="(version=0.20.0, branch=HEAD, revision=f74be0400a6243d10bb53812d6fa408ad71ff32d)"
level=info ts=2020-05-21T15:14:56.850Z caller=main.go:232 build_context="(go=go1.13.5, user=root@00c3106655f8, date=20191211-14:13:14)"
level=info ts=2020-05-21T15:14:56.859Z caller=cluster.go:161 component=cluster msg="setting advertise address explicitly" addr=10.250.0.83 port=9094
level=info ts=2020-05-21T15:14:56.868Z caller=cluster.go:623 component=cluster msg="Waiting for gossip to settle..." interval=2s
level=info ts=2020-05-21T15:14:56.883Z caller=coordinator.go:119 component=configuration msg="Loading configuration file" file=alertmanager.yml
level=info ts=2020-05-21T15:14:56.883Z caller=coordinator.go:131 component=configuration msg="Completed loading of configuration file" file=alertmanager.yml
level=info ts=2020-05-21T15:14:56.885Z caller=main.go:497 msg=Listening address=:9093
You can see that the application starts up, and then the listening address port is displayed indicating in this instance the AlertManager is listening on port 9093.
Now that the configuration has been called out, let’s take a look at how this looks put all together.
To see the status of the alerts within the Prometheus environment, you can navigate to the Alerts menu item, or to the URL http://<hostname_or_ip>:9090/alerts. Once there, the following image shows the status of each of the rules within the files that the rules are being added to.
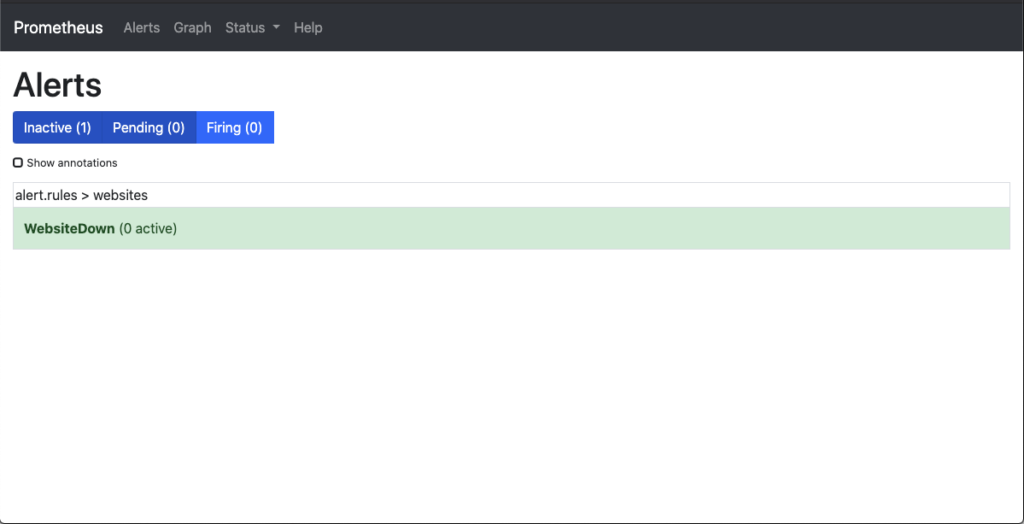
At this point there are no websites down. To confirm this in the Prometheus Graph you can search for ALERTS within the graph application of Prometheus. You should get the message No datapoints found. if you have nothing alerting. This will help you understand if you are receiving an alert status and it is being suppressed or if there is something else wrong with the configuration.
At this point I am going to have my DNS server deny access to the ServiceNow website. This will simulate the service unavailable
After some time the website becomes non responsive. Next we can see within the Alerts management page that Prometheus was first in a waiting status that the website was down, but had not crossed the threshold for amount of time that was set (1 minute). You see the 1 pending rule.
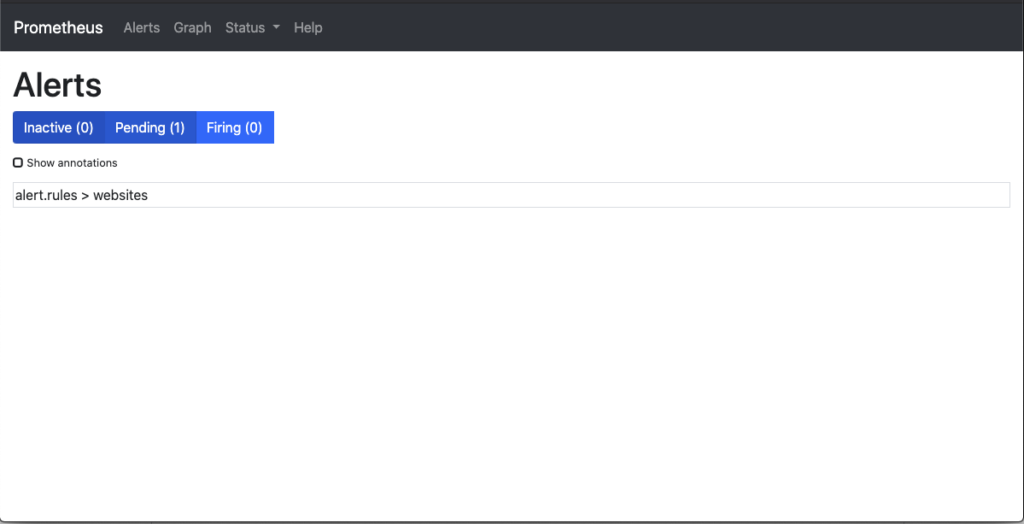

Once the threshold that was defined has passed, the alert will move from a Pending state to a Firing state. In this state Prometheus has sent the alert off to AlertManager to handle the processing of the alert.
First, let’s take a look at the Prometheus Alerts page. This page shows that the alert has moved through to the Firing phase. This has the same information that you seen in the Pending state but now in the red state.
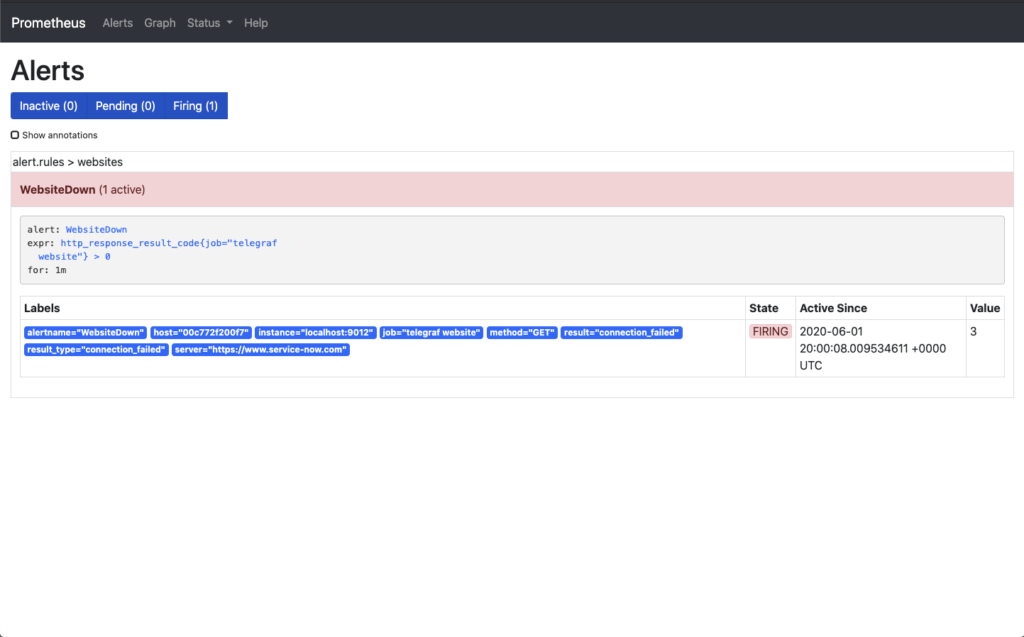
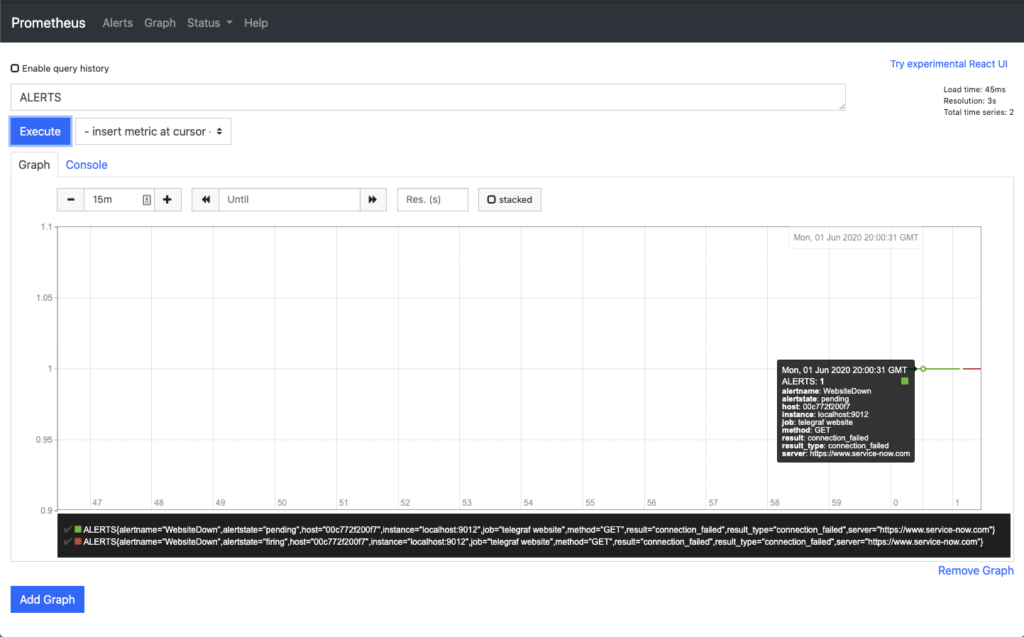
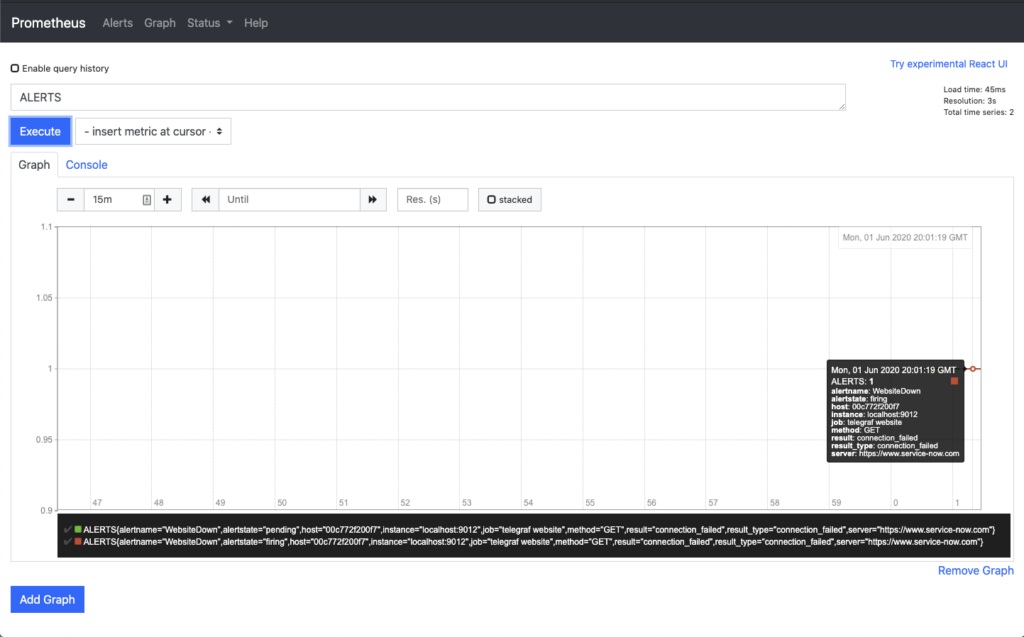
Now, moving on to the Graph section of Prometheus and searching for ALERT, you can now see the lines along the way of the state of the ALERT.
At the start the graph with the mouse cursor over the section indicating when the event was in a Pending state. The second graph shows the mouse hovering over the Firing state. Each gives you additional information to help debug if alerts are not getting to their destination.
The last image is the view from the AlertManager perspective. This shows what alerts have been triggered and which tags are found within the search for the alert.

This wraps up (for now) this series of posts focused on leveraging Telegraf, Prometheus, and Grafana to monitor your environment. Take a look at the post list below for the others in the series and jump on into the Network to Code Slack Telemetry channel to start a conversation on what you are doing, what you want to do, or just to talk network telemetry!
Hope this has been helpful!
-Josh (@vanderaaj)
Share details about yourself & someone from our team will reach out to you ASAP!