Monitor Your Network With gNMI, SNMP, and Grafana

Blog Detail

This post, the second in a series focused on using Telegraf, Prometheus, and Grafana for Network Telemetry, will focus on transforming data and making additional graphs within Grafana. This post will cover the following topics:

  • Telegraf
    • Gathering streaming data with gNMI, as an alternative to SNMP
    • Changing data with Enum and Replacement
    • Tagging Data
  • Prometheus
    • Prometheus Query Language (PromQL)
  • Advancing Your Grafana Capabilities
    • Variables
    • Tables (BGP Table)
    • Device Dashboards vs Environment Dashboards

Here is where you can find the first post in the series on how to gather data from SNMP based devices.

Purpose

The intent of this post is to demonstrate how to bring multiple telemetry gathering methods into one. In our experience, a successful telemetry & analytics stack should be able to collect data transparently from SNMP, telemetry Streaming (gNMI) and CLI/API. We covered SNMP and CLI gathering in previous posts. This post will focus on gathering telemetry data with gNMI. Beyond the collection of data, when we are collecting the same type of data from multiple sources it’s important to ensure that the data will have the format in the database. In this post, we’ll look at how Telegraf can help normalize and decorate the data before sending it to the database.

Network Topology
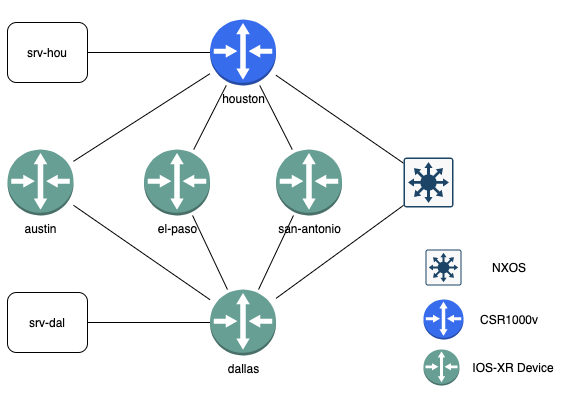
topology

In the topology there is a mix of devices per the table below:

Device NameDevice TypeTelemetry Source
houstonCisco IOS-XESNMP
amarilloCisco NXOSSNMP
austinCisco IOS-XRgNMI
el-pasoCisco IOS-XRgNMI
san-antonioCisco IOS-XRgNMI
dallasCisco IOS-XRgNMI

This blog post was created based on a Cisco-only environment, but if you’re interested in a multi-vendor approach check out @damgarros’s NANOG 77 presentation on YouTube. That video shows how to use only gNMI to collect data from Arista, Juniper, and Cisco devices in a single place. This topology used here is meant to show the collection from multiple sources (SNMP + gNMI) in one.

Application Installs Note

Software installation was covered in the previous post in this series, and I recommend taking a look at either that post for the particular installation instructions, or heading over to the product page referenced in the introduction.

Overview

Here is the sequence of events that is being addressed in this post. I am starting with Telegraf gathering and collecting gNMI data from network devices. This is being processed into Prometheus metrics that will be scraped by a Prometheus server. Then Grafana will generate graphs on the data that is gathered and processed appropriately.
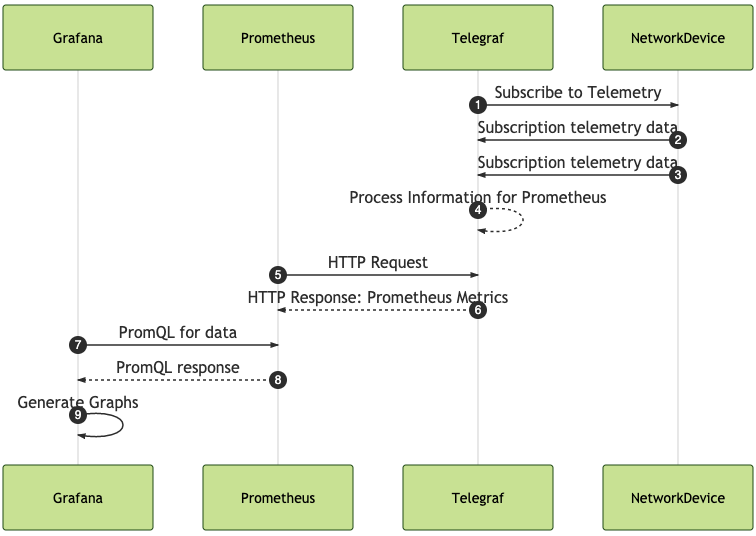
sequence_diagram

gNMI Introduction

gNMI stands for gRPC (Remote Procedure Calls) Network Management Interface. gRPC is a standard developed by Google that leverages HTTP/2 for transport using Protocol Buffers. gNMI is a gRPC-based protocol to get configuration and telemetry from a network device. All messages are defined as protocol buffers that intend to keep data as small as possible in the definition to be as efficient as possible. The data is serialized into the proper format by the device and sent off. This can hold quite a bit of information and is read by the receiver. You can take a look at the gNMI reference for more detailed information.

gNMI can handle not only telemetry data that this post is about, but also is intended to transport configuration about the device as well.

So why use gNMI? gRPC is incredibly fast and efficient at transmitting data, and by extension gNMI is also fast and efficient.

gNMI Cisco Configuration

gNMI is supported by many of today’s leading network vendors. As an example for configuring a Cisco IOS-XR device here are the configuration lines needed to enable gNMI in this demo environment:

grpc
 port 50000
 no-tls

Pretty straight to the point. If you wish to create a subscription model within the Cisco IOS-XR there are some more detailed configuration options available. Take a look at Cisco’s Guide to Configure Model-driven Telemetry

Telegraf

Gathering Streaming Data With gNMI

The first step that I will be walking through is setting up Telegraf to subscribe to gNMI data. This is specifically to collect telemetry data from IOS-XR devices in this lab scenario. With gNMI, like other streaming Telemetry subscriptions, you need to tell the network device that you want to subscribe to receive the data. The device will then send the periodic updates of telemetry data to the receiver. There is a periodic “keep-alive” message sent to keep the subscription active by the subscriber.
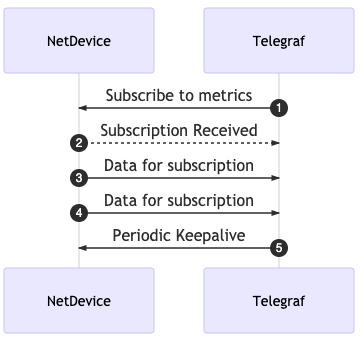
gnmi

gNMI Telegraf Configuration

Telegraf has a plugin that will take care of the subscription and the input section looks like the code below. Note that the subscription port is defined within the addresses section.

[[inputs.cisco_telemetry_gnmi]]
    addresses = ["dallas.create2020.ntc.cloud.tesuto.com:50000"]
    username = <redacted>
    password = <redacted>

    ## redial in case of failures after
    redial = "10s"
    tagexclude = ["openconfig-network-instance:/network-instances/network-instance/protocols/protocol/name"]

    [[inputs.cisco_telemetry_gnmi.subscription]]
        origin = "openconfig-interfaces"
        path = "/interfaces/interface"

        subscription_mode = "sample"
        sample_interval = "10s"

    [[inputs.cisco_telemetry_gnmi.subscription]]
        name = "bgp_neighbor"
        origin = "openconfig-network-instance"
        path = "/network-instances/network-instance/protocols/protocol/bgp/neighbors/neighbor/state"

        subscription_mode = "sample"
        sample_interval = "10s"

[[outputs.prometheus_client]]
  listen = ":9011"

The configuration shows that you define the address, username, and password. This configuration also shows a redial setup in case of a failure and particular subscriptions to be excluded from the request.

There are two subscriptions that we are subscribing to in this instance:

  • openconfig-interfaces
  • openconfig-network-instance (To collect BGP neighbor state)

In each of these cases the sampling will be every 10 seconds in this demo, which means that the device will send the statistics every 10 seconds. Every 10 seconds there will be new metrics available to be scraped by Prometheus. The sample interval and Prometheus scrape interval should be the same interval.

To collect the telemetry for this demo we are once again using the Prometheus client output from Telegraf. Telegraf will collect, process, and format the data that will then be scraped by a Prometheus server. Let’s take a look at what that output looks like next.

gNMI Output – BGP

I’m only going to take a look at a few of the items in the output here. There are too many that would fill up too much real estate in your screen to make it worthwhile.

# HELP bgp_neighbor_messages_received_UPDATE Telegraf collected metric
# TYPE bgp_neighbor_messages_received_UPDATE untyped
bgp_neighbor_messages_received_UPDATE{device="dallas",identifier="BGP",name="default",neighbor_address="10.0.0.1",peer_type="EXTERNAL",role="leaf"} 9
bgp_neighbor_messages_received_UPDATE{device="dallas",identifier="BGP",name="default",neighbor_address="10.0.0.17",peer_type="EXTERNAL",role="leaf"} 0
bgp_neighbor_messages_received_UPDATE{device="dallas",identifier="BGP",name="default",neighbor_address="10.0.0.25",peer_type="EXTERNAL",role="leaf"} 9
bgp_neighbor_messages_received_UPDATE{device="dallas",identifier="BGP",name="default",neighbor_address="10.0.0.9",peer_type="EXTERNAL",role="leaf"} 9

Some items were removed to assist in readability and message delivery

The output is what you would expect. A list of the neighbors identified by the neighbor_address key in the tags. With the BGP subscription you get:

  • bgp_neighbor_established_transitions
  • bgp_neighbor_last_established
  • bgp_neighbor_messages_received_NOTIFICATION
  • bgp_neighbor_messages_received_UPDATE
  • bgp_neighbor_messages_sent_NOTIFICATION
  • bgp_neighbor_messages_sent_UPDATE
  • bgp_neighbor_peer_as
  • bgp_neighbor_peer_as
  • bgp_neighbor_queues_output
  • bgp_neighbor_session_state

gNMI Output – Interfaces

There are a lot of statistics sent back with the interface subscription. We’ll be taking a look at just one of them, interface_state_counters_in_octets, in this instance. We get a look at each interface and its associated counter in the data.

interface_state_counters_in_octets{device="dallas",name="GigabitEthernet0/0/0/0",role="leaf"} 3.2022595e+07
interface_state_counters_in_octets{device="dallas",name="GigabitEthernet0/0/0/1",role="leaf"} 3.077077e+06
interface_state_counters_in_octets{device="dallas",name="GigabitEthernet0/0/0/2",role="leaf"} 1.5683204947e+10
interface_state_counters_in_octets{device="dallas",name="GigabitEthernet0/0/0/3",role="leaf"} 1.627459e+06
interface_state_counters_in_octets{device="dallas",name="GigabitEthernet0/0/0/4",role="leaf"} 1.523158e+06
interface_state_counters_in_octets{device="dallas",name="GigabitEthernet0/0/0/5",role="leaf"} 35606
interface_state_counters_in_octets{device="dallas",name="GigabitEthernet0/0/0/6",role="leaf"} 35318
interface_state_counters_in_octets{device="dallas",name="GigabitEthernet0/0/0/7",role="leaf"} 35550
interface_state_counters_in_octets{device="dallas",name="GigabitEthernet0/0/0/8",role="leaf"} 35878
interface_state_counters_in_octets{device="dallas",name="GigabitEthernet0/0/0/9",role="leaf"} 36684
interface_state_counters_in_octets{device="dallas",name="MgmtEth0/RP0/CPU0/0",role="leaf"} 2.2033861e+07
interface_state_counters_in_octets{device="dallas",name="Null0",role="leaf"} 0
interface_state_counters_in_octets{device="dallas",name="SINT0/0/0",role="leaf"} 0

This is great information, and we have seen something similar with SNMP. Now to the transformations that Telegraf offers.

Changing data with Enum and Replacement

Telegraf has a couple of different processors available to process the data and get it into a format that is appropriate and consistent for your environment. Let’s take a look at a couple of them and how they are used in the use case here.

Telegraf – Enum

The first processor used is within the BGP data collection. When the data comes back from the subscription for a BGP session state, it comes back as a string value. It is great to be able to read the current state, but is not very helpful for a Time Series Data Base (TSDB). A TSDB is looking to get the data back represented as a number of some sort, either an integer or a float. The whole point is to measure information at a point in time.

The Telegraf process then looks like this:

telegraf_process

To accommodate this, the use of the enum processor is put into action. The following is added to the configuration:

[[processors.enum]]
  [[processors.enum.mapping]]
    ## Name of the field to map
    field = "session_state"

    [processors.enum.mapping.value_mappings]
      IDLE = 1
      CONNECT = 2
      ACTIVE = 3
      OPENSENT = 4
      OPENCONFIRM = 5
      ESTABLISHED = 6

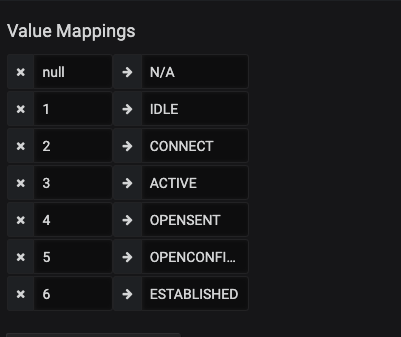
Within the session_state any instances of the string IDLE will be replaced with the integer 1. This is then set up to store for the long term within a TSDB. This is the same then for all of the rest of the states as well, with ESTABLISHED states stored as the integer 6. Later in Grafana this number will be reversed into the word for representation on a graph.

Telegraf – Rename

The second processor that is used in this demo is the rename processor. This rename processor has a function to replace items. Below is what is used to rename the SNMP counters that are collected for SNMP devices and moved to match the names for gNMI.

[[processors.rename]]
  [[processors.rename.replace]]
    field = "ifHCInOctets"
    dest = "state_counters_in_octets"

  [[processors.rename.replace]]
    field = "ifHCOutOctets"
    dest = "state_counters_out_octets"

This states that if looking for ifHCInOctets – replace the field with state_counters_in_octets. And the same for the outbound with ifHCOutOctets replacing with state_counters_out_octets. Once Telegraf has replaced those fields, you can use the data gathered with SNMP and that with gNMI in the same queries!

Tagging Data

Tagging data is one of the biggest favors that you can do for yourself. Tagging gives flexibility for future analysis, comparison, and graphing data points. For instance if you tag your BGP neighbors with the upstream peer provider, you will be able to easily identify the interfaces which belong to that particular peer. If you have four geographically diverse interfaces, this will allow you to quickly identify the interfaces based on the tag rather than manually deciding later at the time of graphing or alerting.

This brings us to the third Telegraf processor in this post regex processor. This processor will take a regex search pattern, and complete the replacement. Something new here is that if you use the result_key option, a new field will be created and not replace what is there, resulting in a whole new field. This regex replacement will add a new tag for intf_role using server as the definition.

  [[processors.regex.tags]]
    key = "name"
    pattern = "^GigabitEthernet0\/0\/0\/2$"
    replacement = "server"
    result_key = "intf_role"

Looking at just this particular replacement in the output, there are now additional tags for graphing, alerting, and general data analysis.

interface_state_admin_status{device="dallas",intf_role="server",name="GigabitEthernet0/0/0/2",role="leaf"} 1
interface_state_counters_in_broadcast_pkts{device="dallas",intf_role="server",name="GigabitEthernet0/0/0/2",role="leaf"} 8

Prometheus

Prometheus Query Language

Throughout the upcoming Grafana section you will get to see a number of PromQL (Prometheus Query Language) queries. Take a look at the Prometheus.io basics page to get full documentation of the queries that are available. It is these queries that are being executed that will be used by Grafana to populate the data in the graphs.

Grafana

Through the next several sections you will get to see how to build a dashboard using PromQL and variable substitution, among other topics to build these dashboards on a per device basis. From a device perspective dashboard, these two dashboards look different in the number of interfaces and neighbors displayed, but they are born out of the same dashboard configuration.

grafana_device_01
grafana_device_02

Variables

First, you’ll need to set up the variable device that is seen on the upper left hand corner of the dashboard. When I first started building dashboards I remember that this may be one of the most important skills when looking to level up your Grafana dashboards, as it will allow you to get significant amount of value while reducing re-work to keep adding additional devices into a panel.

Variables – Adding to Your Dashboard

To add a dashboard wide variable follow these steps:

  • Navigate into your dashboard
  • Click on the gear icon in the upper right hand navigation section
  • Click on Variables
  • Click the green New button on the right hand side
grafana_variables

This image already had a variable added, which is the devices

Once in the new screen you will have the following image:
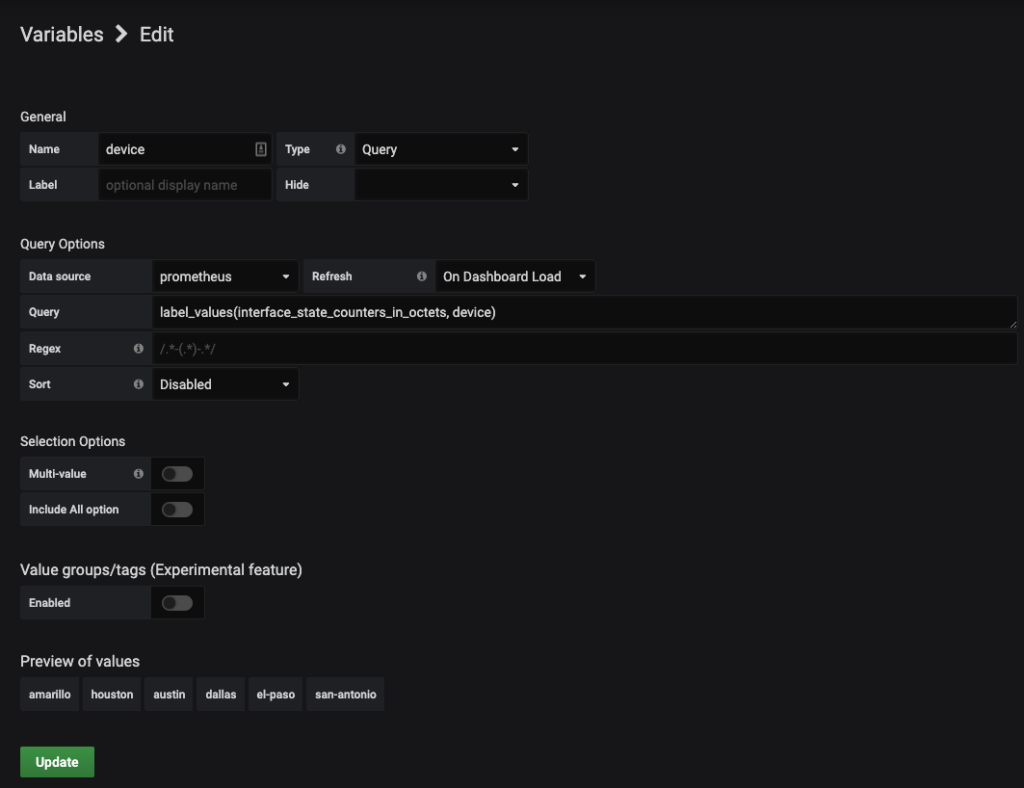
grafana_add_variable

Here you will be defining a PromQL query to build out your device list. In the bottom section of the screen you see the heading of Preview of values. Here you will be able to observe a sample of what the query will result in for your variables.

The fields that you need to fill in include:

FieldInformation Needed
NameName of the variable you wish to use
TypeQuery
Data sourcePrometheus
RefreshWhen would you like to refresh the variables? Use the dropdown to select which fits your org best
QueryPromQL to get the data points
RegexRegex search to reduce the search results

You can experiment with the rest of the fields as you see fit to get your variables defined properly.

Once you have your search pattern set, make sure to click Save on the left hand side of Grafana.

To reference the variables once they are created, you use the dollar sign ($) in front of the name for Grafana to execute that as a variable within a query. Within the Legend area the use of Jinja-like formatting of the double curly braces will identify as a variable.

Grafana Plugins

Grafana is extensible via the use of plugins. There are quite a few plugins available for Grafana and I encourage you to take a look at the plugin page to be able to search for what you may want to use on your own. There are 3 types of plugins: Panel, Data Source, and App to help extend the Grafana capabilities.

Grafana Discrete Plugin (BGP State Over Time)

The next table to take a look at is using a feature within Grafana that allows you to add plugins. I’ll look at how we were able to build out the graph. This can help to identify issues quickly in your environment by just looking at the dashboard. Take a look at this where there was a BGP neighbor that was down. It is quickly identifiable on the dashboard and that action will be needed.

grafana_bgp_down

The two panels in the top row are using a Grafana plugin called Discrete. This provides data values in the color that is defined within the configuration over time. The panel then gives you the ability to hover over to see the changes over time. You install the plugin with the grafana-cli command:

grafana-cli plugins install natel-discrete-panel
sudo systemctl restart grafana

Once installed you can setup a new panel with the panel type of Discrete.

The panel will be created with the following parameters

BGP Session Status – Discrete Panel 1

Query: Prometheus data source

KeyValue
Metricsbgp_neighbor_session_state{device=”$device”}
Legend{{ device }} {{ neighbor_address }}
Min step
Resolution1/1
FormatTime series
InstantUnchecked

You will note that in the Metrics section the variable reference is $device, noted by the dollar sign in the device name. The Legend has two variables included in both the device and neighbor_address within the Legend. This is what gets displayed in the discrete table for each line.

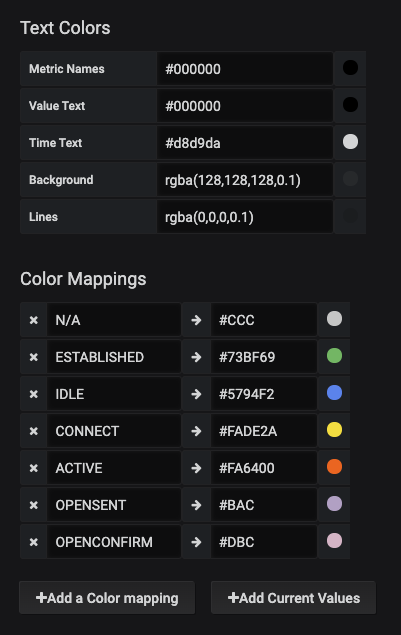
grafana_discrete_page1
grafana_discrete_color_selection
grafana_discrete_value_mappings
Critical Interface State – Discrete Panel 2

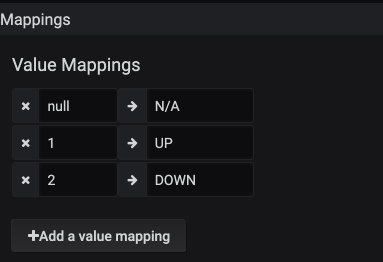
Now because the interfaces have been assigned a label, a discrete panel can be generated to show the interface state, along with the role. For demonstration, we are naming this panel Critical Interfaces, the interfaces for Servers or Uplinks to other network devices have been labeled as with server or uplink accordingly. By querying for any role we can get thi information into the panel. The legend has the value of {{device}} {{name}} > {{intf_role}} > {{neighbor}} to get to the appropriate mappings that are to be shown. This is the resulting panel:

grafana_critical_intf_state

To get to this panel we can see the following discrete panel settings. This panel build is a little bit smaller, but gets a lot of information added into a panel!

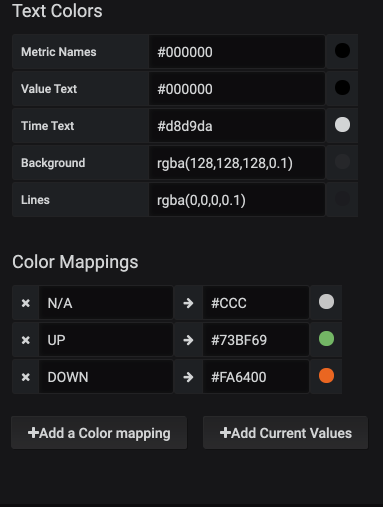
grafana_intf_state_pg1
grafana_inft_state_txt_color1
grafana_intf_state_mappings

Device Dashboards vs Environment Dashboards

This is not a pick one over the other segment, rather this is saying that both should be present in your Grafana Dashboard setup.

In this post I have gone through and shown a lot of device-specific panels. The value here is that you are able to get to a device by device-specific view very quickly, without having to create a separate page for each and every device in your environment. That said, that the panels can be expanded by the use of variables to identify individual devices.

You should also look at using an environment dashboard where you are getting specific pieces of information to match your need. Need to know what an application performance looks like that includes Network, Server, Storage, and Application performance? You can work to build out these dashboards by hand, but this will take longer to build. As you leverage tags in the gathering of telemetry into your TSDB, you will be on your way to building dashboards in an automated fashion to get the big picture very quickly.


Conclusion

Hopefully this has been helpful. Again, check out the first post in the series if you need more information on these tools generally. In the next post, I will cover how to advance your Prometheus environment with monitoring remote sites and a I’ll discuss a couple of methodologies to enable alerting within the environment.

The next post will include how to alert using this technology stack.

-Josh


ntc img
ntc img

Contact Us to Learn More

Share details about yourself & someone from our team will reach out to you ASAP!

Network Telemetry for SNMP Devices

Blog Detail

This is going to be the first in a multipart series where I will be taking a look at a method to get telemetry data from network devices into a modern Time Series Database (TSDB).

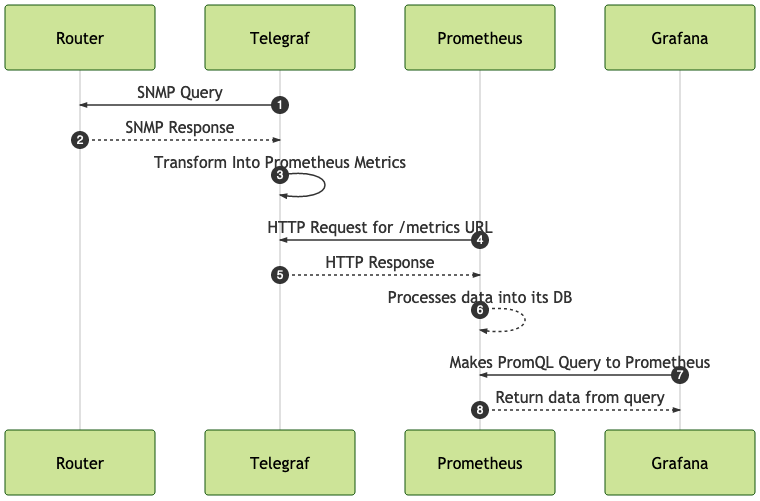
In this particular post I will be working through adding SNMP based device data into the Prometheus TSDB. I will be using Telegraf from InfluxData to gather the SNMP data from Cisco devices on an emulation platform. Prometheus will then scrape the data from Telegraf and store the metrics. I will then show in how to start building out graphs within Grafana.

sequence

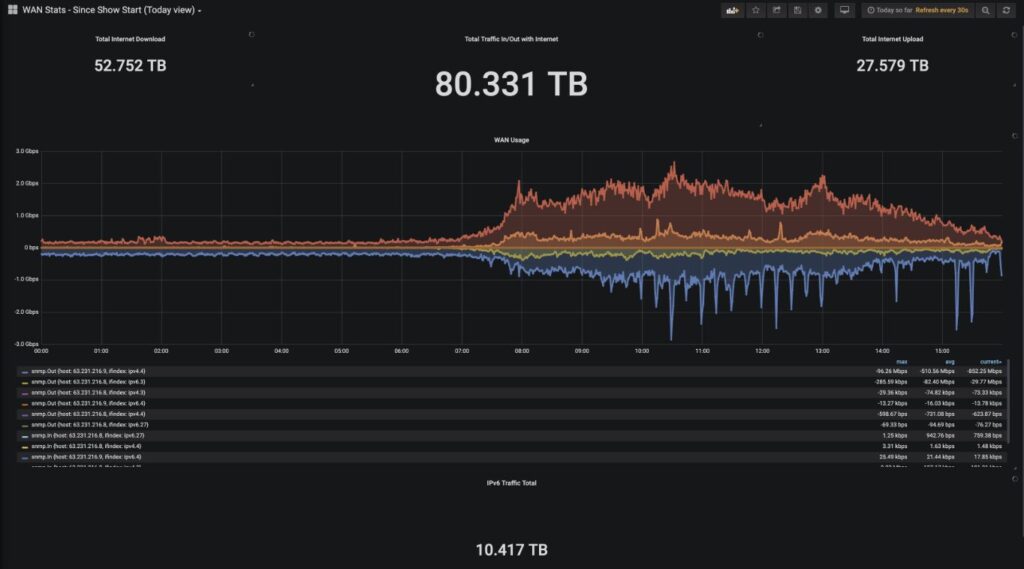
Here is an example of a Grafana dashboard that could be made:

From @SNMPguy for Cisco Live

ciscoliveusgraph

Gathering Data – Concepts

At this point there are many advertisements that Streaming Telemetry is a must have in this day and age for gathering network device metrics. However, there are still quite a few network devices that do not support Streaming Telemetry in networks today. If you have a large deployment of these types of devices are you out of luck if you want to use a modern TSDBs? No you are not. Gathering data into a TSDB is all about just that, gathering data. If you gather the data via Streaming Telemetry or SNMP, either way, you are gathering the data. Streaming Telemetry is generally thought of as less intensive of a process on devices and has some other benefits. So if you can gather the data with Streaming Telemetry, then you should. But if you must use SNMP, this article is here to help you out.

Gathering Data – CLI Parsing

Through this post you will see information gathered via SNMP. If you wish to look at using CLI parsing as a method to get metrics, take a look at our previous post.

Gathering Data via SNMP

This post will outline what Telegraf has to offer when it comes to gathering data. Telegraf is an application made available by InfluxData that will gather data from various places. The gathering of information is known as an input. Then you will see how to send or make the data available for TSDB – Prometheus. These are known as the outputs. You can take a look at the plugins list to see the list of plugins for Telegraf 1.14, which as of this writing (2020-04-21) is the latest version.

Telegraf has the capability to also transform, tag, and modify data as needed. Portions of that will be covered in a follow-up post.

Within the configuration files you can setup to have a single Telegraf process poll multiple devices or you can have multiple Telegraf processes or containers, with each one polling one device. In this post I will be showing how to configure a single device to be polled by Telegraf. By this nature you can have your Telegraf agents centralized or distributed as needed.

A Prometheus nuance is that Prometheus will assume a device is down if Prometheus is unable to scrape the device’s metric page. But collecting SNMP data, the collection will be of the Telegraf process, which should get tied to its ability to poll the device. So additional configuration will be needed for Prometheus alerting in respects to reading metrics from a Telegraf plugin.

The SNMP configuration is made within the Telegraf configuration. This configuration may look like the following:

[[inputs.snmp]]
  agents = ["minneapolis.ntc"]
  version = 2
  community = "SecuredSNMPString"
  interval = "60s"
  timeout = "10s"
  retries = 3

  [[inputs.snmp.field]]
    name = "hostname"
    oid = ".1.3.6.1.2.1.1.5.0"
    is_tag = true

  [[inputs.snmp.field]]
    name = "uptime"
    oid = "1.3.6.1.2.1.1.3.0"

  [[inputs.snmp.field]]
    name = "cpmCPUTotal1min"
    oid = ".1.3.6.1.4.1.9.9.109.1.1.1.1.4.7"

  #####################################################
  #
  # Gather Interface Statistics via SNMP
  #
  #####################################################

  # IF-MIB::ifTable contains counters on input and output traffic as well as errors and discards.
  [[inputs.snmp.table]]
    name = "interface"
    inherit_tags = [ "hostname" ]
    oid = "IF-MIB::ifTable"

    # Interface tag - used to identify interface in metrics database
    [[inputs.snmp.table.field]]
      name = "name"
      oid = "IF-MIB::ifDescr"
      is_tag = true

  # IF-MIB::ifXTable contains newer High Capacity (HC) counters that do not overflow as fast for a few of the ifTable counters
  [[inputs.snmp.table]]
    name = "interface"
    inherit_tags = [ "hostname" ]
    oid = "IF-MIB::ifXTable"

    # Interface tag - used to identify interface in metrics database
    [[inputs.snmp.table.field]]
      name = "name"
      oid = "IF-MIB::ifDescr"
      is_tag = true
  
  # EtherLike-MIB::dot3StatsTable contains detailed ethernet-level information about what kind of errors have been logged on an interface (such as FCS error, frame too long, etc)
  [[inputs.snmp.table]]
    name = "interface"
    inherit_tags = [ "hostname" ]
    oid = "EtherLike-MIB::dot3StatsTable"
  
    # Interface tag - used to identify interface in metrics database
    [[inputs.snmp.table.field]]
      name = "name"
      oid = "IF-MIB::ifDescr"
      is_tag = true

Note: In testing I have found that the Cisco CPU query can be different per device. I recommend testing per platform and perhaps per OS version to verify that the SNMP polling works properly. I have found that issuing the command snmpwalk -v 2c -c SecuredSNMPString minneapolis.ntc .1.3.6.1.4.1.9.9.109.1.1.1.1.4 to find the response. You can also look at some other SNMP OIDs available as well for Cisco at their doc page

Difference Between snmp.table and snmp.field

Now, we’ll briefly dig in to what each of the lines are doing here. When an SNMP field is defined, this is going to act like an snmpget on a device. The first section that we call hostname is getting the hostname of the device.

What is a Tag?

The is_tag will be used as a tag on the data that is called later. Tags are data points that will help to classify other pieces of information. This can be helpful in filtering data points, or associating data points with a particular query or other data point.

Tags will be covered in more detail in a subsequent post, but note that by leveraging tags in your templates that build the Telegraf configuration you are able to identify key components in the environment that will enhance the monitoring capabilities.

Jumping ahead, and using the Prometheus output you can see some of these tags and fields in action. snmp_ is added to the front of the name as a part of the Prometheus export. You are able see the result of the query on the right most, outside of the {}. Inside of the {} you have the various tags that are being applied.

# HELP snmp_cpmCPUTotal1min Telegraf collected metric
# TYPE snmp_cpmCPUTotal1min untyped
snmp_cpmCPUTotal1min{agent_host="minneapolis.ntc",device="minneapolis",host="225bb1fc7f4c",hostname="minneapolis.ntc",} 31
# HELP snmp_uptime Telegraf collected metric
# TYPE snmp_uptime untyped
snmp_uptime{agent_host="minneapolis.ntc",device="minneapolis",host="225bb1fc7f4c",hostname="minneapolis.ntc",} 1.2636057e+07

Exporting the SNMP Data

There are two majority leaders in my opinion in the open source TSDB market, InfluxDB and Prometheus. Both have outputs that you can leverage with Telegraf to get the data into the TSDB. I will focus on the Prometheus methodology here. By exporting data with the Prometheus output there are a couple of benefits. One, the data is able to be scraped by the Prometheus system. The second is you can get a very good visual representation of the data for troubleshooting your connections.

If you are using InfluxDB as your DB and need to troubleshoot, I find setting up a Prometheus exporter as a helpful step to be able to see what tags are being defined and what data is being gathered from an SNMP standpoint.

Output to Prometheus Configuration

The configuration for Telegraf to use the Prometheus metrics exporter is relatively short and sweet. Telegraf handles the heavy lifting once you set the configuration file.

#####################################################
#
# Export SNMP Information to Prometheus
#
#####################################################

[[outputs.prometheus_client]]
  listen = ":9012"
  metric_version = 2

Here you see that the section begins with [[outputs.prometheus_client]]. This is with no indentation within the configuration file. It sets the metric_version to 2, and then sets a port that the metrics will be exposed at on, here tcp/9012. The url is then http://<server_url/ip>:<listen_port>/metrics. Note the /metrics as defined is a best practice of Prometheus.

Let’s take a look at the output from the metrics page below. There are many more metrics that get exposed than just what is shown. This will show only the one related to octets inbound on the interface.

Prometheus Output

Within the tags you see the main metric name begins with interface_. This is added by the client exporter to assist in classification of the metric. You then see the actual metric name as collected by SNMP. Here it is appended to the end of interface_ to get the metric name.

You also see the tags that are assigned to the metric being presented. Below is a table of the tag and where it came from:

TagCame From
agent_hostCreated by Telegraf
hostHost that is collecting the data, here the name of the Docker container
hostnameTag defined within the input section for gathering the hostname, the input section specifies inherit_tags to inherit the hostname
ifNameWithin the inputs.snmp.table.field section of the ifTable, noted by is_tag
nameThe name of the interface, defined in the input section

After the tags, the Prometheus metric definition indicates that this is where the actual measurement is to be placed. The Prometheus engine will “scrape” this information from the HTTP page and then ingest the data appropriately into its DB.

# HELP interface_ifHCInOctets Telegraf collected metric
# TYPE interface_ifHCInOctets untyped
interface_ifHCInOctets{agent_host="minneapolis.ntc",host="225bb1fc7f4c",hostname="minneapolis.ntc",ifName="Gi1",name="GigabitEthernet1"} 2.4956199e+07
interface_ifHCInOctets{agent_host="minneapolis.ntc",host="225bb1fc7f4c",hostname="minneapolis.ntc",ifName="Gi7",name="GigabitEthernet7"} 0
interface_ifHCInOctets{agent_host="minneapolis.ntc",host="225bb1fc7f4c",hostname="minneapolis.ntc",ifName="Gi8",name="GigabitEthernet8",} 0
interface_ifHCInOctets{agent_host="minneapolis.ntc",host="225bb1fc7f4c",hostname="minneapolis.ntc",ifName="Nu0",name="Null0",} 0
interface_ifHCInOctets{agent_host="minneapolis.ntc",host="225bb1fc7f4c",hostname="minneapolis.ntc",ifName="Vo0",name="VoIP-Null0",} 0
interface_ifHCInOctets{agent_host="minneapolis.ntc",host="225bb1fc7f4c",hostname="minneapolis.ntc",ifName="Gi3",name="GigabitEthernet3",} 1.092917e+08
interface_ifHCInOctets{agent_host="minneapolis.ntc",host="225bb1fc7f4c",hostname="minneapolis.ntc",ifName="Gi2",name="GigabitEthernet2",} 1.477766e+06
interface_ifHCInOctets{agent_host="minneapolis.ntc",host="225bb1fc7f4c",hostname="minneapolis.ntc",ifName="Gi4",name="GigabitEthernet4",} 1.9447063e+07
interface_ifHCInOctets{agent_host="minneapolis.ntc",host="225bb1fc7f4c",hostname="minneapolis.ntc",ifName="Gi5",name="GigabitEthernet5",} 1.2468643e+07
interface_ifHCInOctets{agent_host="minneapolis.ntc",host="225bb1fc7f4c",hostname="minneapolis.ntc",ifName="Gi6",name="GigabitEthernet6",} 1.6549974e+07

Prometheus

After getting the data into a format that Prometheus can read, you need to install Prometheus. You will get a link for the long lived installation, but the best part about Prometheus is that you can get up and running by just executing the binary file.

Installation – Binary Execution

Link: Prometheus installation provides for documentation on getting Prometheus up and running on your system.

Installation – Download, Decompress, and Copy Binary to Local Folder

For this the installation will be of the 2.16.0 version that has a download link of https://github.com/prometheus/prometheus/releases/download/v2.16.0/prometheus-2.16.0.linux-amd64.tar.gz.

On a Linux host, wget is able to download the file into your local working directory.

josh@prometheus_demo:~$ wget https://github.com/prometheus/prometheus/releases/download/v2.16.0/prometheus-2.16.0.linux-amd64.tar.gz
--2020-03-14 18:20:41--  https://github.com/prometheus/prometheus/releases/download/v2.16.0/prometheus-2.16.0.linux-amd64.tar.gz
Resolving github.com (github.com)... 140.82.114.3
Connecting to github.com (github.com)|140.82.114.3|:443... connected.
HTTP request sent, awaiting response... 302 Found
Location: https://github-production-release-asset-2e65be.s3.amazonaws.com/6838921/13326f00-4ede-11ea-98d2-3ed3a8fdfe99?X-Amz-Algorithm=AWS4-HMAC-SHA256&X-Amz-Credential=AKIAIWNJYAX4CSVEH53A%2F20200314%2Fus-east-1%2Fs3%2Faws4_request&X-Amz-Date=20200314T182041Z&X-Amz-Expires=300&X-Amz-Signature=9d4b3578b43c357056d75698f94bf8fb3263510787046db5fe04fabd3196023a&X-Amz-SignedHeaders=host&actor_id=0&response-content-disposition=attachment%3B%20filename%3Dprometheus-2.16.0.linux-amd64.tar.gz&response-content-type=application%2Foctet-stream [following]
--2020-03-14 18:20:41--  https://github-production-release-asset-2e65be.s3.amazonaws.com/6838921/13326f00-4ede-11ea-98d2-3ed3a8fdfe99?X-Amz-Algorithm=AWS4-HMAC-SHA256&X-Amz-Credential=AKIAIWNJYAX4CSVEH53A%2F20200314%2Fus-east-1%2Fs3%2Faws4_request&X-Amz-Date=20200314T182041Z&X-Amz-Expires=300&X-Amz-Signature=9d4b3578b43c357056d75698f94bf8fb3263510787046db5fe04fabd3196023a&X-Amz-SignedHeaders=host&actor_id=0&response-content-disposition=attachment%3B%20filename%3Dprometheus-2.16.0.linux-amd64.tar.gz&response-content-type=application%2Foctet-stream
Resolving github-production-release-asset-2e65be.s3.amazonaws.com (github-production-release-asset-2e65be.s3.amazonaws.com)... 52.216.238.3
Connecting to github-production-release-asset-2e65be.s3.amazonaws.com (github-production-release-asset-2e65be.s3.amazonaws.com)|52.216.238.3|:443... connected.
HTTP request sent, awaiting response... 200 OK
Length: 59608515 (57M) [application/octet-stream]
Saving to: ‘prometheus-2.16.0.linux-amd64.tar.gz’

prometheus-2.16.0.linux-amd64.tar.gz        100%[==========================================================================================>]  56.85M  23.8MB/s    in 2.4s

2020-03-14 18:20:44 (23.8 MB/s) - ‘prometheus-2.16.0.linux-amd64.tar.gz’ saved [59608515/59608515]
josh@prometheus_demo:~$ tar -xvzf prometheus-2.16.0.linux-amd64.tar.gz
prometheus-2.16.0.linux-amd64/
prometheus-2.16.0.linux-amd64/LICENSE
prometheus-2.16.0.linux-amd64/promtool
prometheus-2.16.0.linux-amd64/NOTICE
prometheus-2.16.0.linux-amd64/consoles/
prometheus-2.16.0.linux-amd64/consoles/node.html
prometheus-2.16.0.linux-amd64/consoles/index.html.example
prometheus-2.16.0.linux-amd64/consoles/prometheus-overview.html
prometheus-2.16.0.linux-amd64/consoles/node-disk.html
prometheus-2.16.0.linux-amd64/consoles/node-overview.html
prometheus-2.16.0.linux-amd64/consoles/node-cpu.html
prometheus-2.16.0.linux-amd64/consoles/prometheus.html
prometheus-2.16.0.linux-amd64/console_libraries/
prometheus-2.16.0.linux-amd64/console_libraries/menu.lib
prometheus-2.16.0.linux-amd64/console_libraries/prom.lib
prometheus-2.16.0.linux-amd64/prometheus
prometheus-2.16.0.linux-amd64/prometheus.yml
prometheus-2.16.0.linux-amd64/tsdb
cp prometheus-2.16.0.linux-amd64/prometheus .

Create a Base Configuration on Host

You can use this as a start of the configuration, it will be stored in the same local directory that you are working in. It is setting a default scrape interval for other jobs that do not have a scrape_interval set to 15s. The example will use prometheus_config.yml for the file name.

global:
  scrape_interval: "15s"

scrape_configs:
  - job_name: 'prometheus'
    scrape_interval: "5s"
    static_configs:
      - targets: ['localhost:9090']

Execution

Now that there is a configuration file ready to go, you can start the local server. This will start up without polling anything other than the local Prometheus instance.

josh@prometheus_demo:~$ ./prometheus --config.file="prometheus_config.yml"
level=info ts=2020-03-14T18:29:50.782Z caller=main.go:295 msg="no time or size retention was set so using the default time retention" duration=15d
level=info ts=2020-03-14T18:29:50.783Z caller=main.go:331 msg="Starting Prometheus" version="(version=2.16.0, branch=HEAD, revision=b90be6f32a33c03163d700e1452b54454ddce0ec)"
level=info ts=2020-03-14T18:29:50.783Z caller=main.go:332 build_context="(go=go1.13.8, user=root@7ea0ae865f12, date=20200213-23:50:02)"
level=info ts=2020-03-14T18:29:50.783Z caller=main.go:333 host_details="(Linux 4.15.0-88-generic #88-Ubuntu SMP Tue Feb 11 20:11:34 UTC 2020 x86_64 prometheus_demo (none))"
level=info ts=2020-03-14T18:29:50.783Z caller=main.go:334 fd_limits="(soft=1024, hard=1048576)"
level=info ts=2020-03-14T18:29:50.783Z caller=main.go:335 vm_limits="(soft=unlimited, hard=unlimited)"
level=info ts=2020-03-14T18:29:50.784Z caller=web.go:508 component=web msg="Start listening for connections" address=0.0.0.0:9090
level=info ts=2020-03-14T18:29:50.784Z caller=main.go:661 msg="Starting TSDB ..."
level=info ts=2020-03-14T18:29:50.788Z caller=head.go:577 component=tsdb msg="replaying WAL, this may take awhile"
level=info ts=2020-03-14T18:29:50.788Z caller=head.go:625 component=tsdb msg="WAL segment loaded" segment=0 maxSegment=2
level=info ts=2020-03-14T18:29:50.788Z caller=head.go:625 component=tsdb msg="WAL segment loaded" segment=1 maxSegment=2
level=info ts=2020-03-14T18:29:50.788Z caller=head.go:625 component=tsdb msg="WAL segment loaded" segment=2 maxSegment=2
level=info ts=2020-03-14T18:29:50.789Z caller=main.go:676 fs_type=EXT4_SUPER_MAGIC
level=info ts=2020-03-14T18:29:50.789Z caller=main.go:677 msg="TSDB started"
level=info ts=2020-03-14T18:29:50.790Z caller=main.go:747 msg="Loading configuration file" filename=prometheus_config.yml
level=info ts=2020-03-14T18:29:50.790Z caller=main.go:775 msg="Completed loading of configuration file" filename=prometheus_config.yml
level=info ts=2020-03-14T18:29:50.790Z caller=main.go:630 msg="Server is ready to receive web requests."

At the end you should see a message that states that the Server is ready to receive web requests.

Prometheus

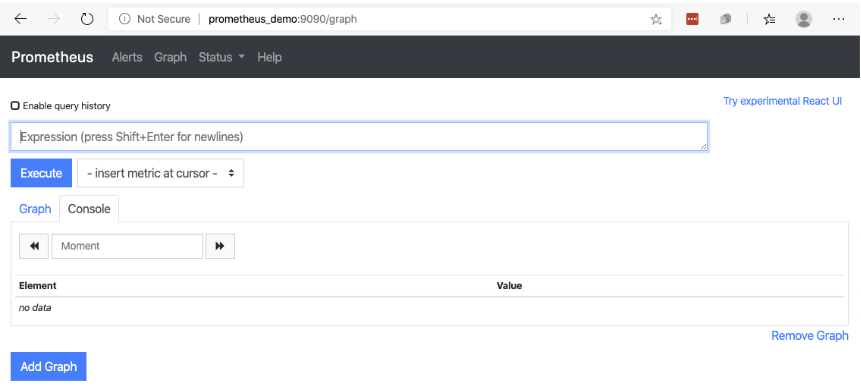
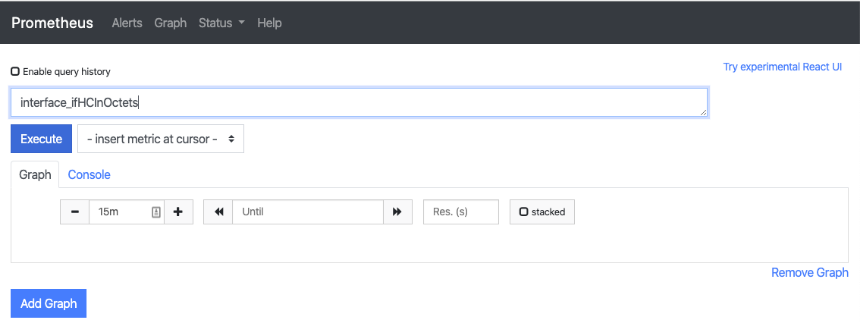
With a web browser, open to the URL: http://<server_ip>:9090 or if using a local installation http://localhost:9090 which should add a redirect to /graph and bring you to a screen like this:

prom-search1

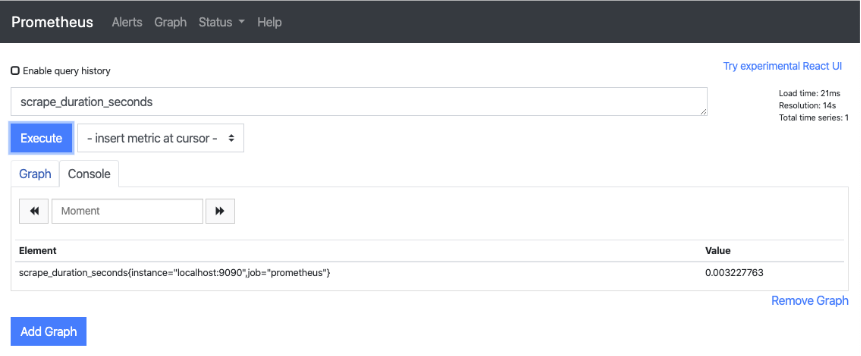
Once you have Prometheus loaded, you can start to use PromQL to do a few searches. The system currently only has one metric source, about itself. This is where a query to see what the process looks like can be done. In the search box enter the query scrape_duration_seconds and click Execute. A response is given back in text form that has an Element and a Value to it.

prom-search2

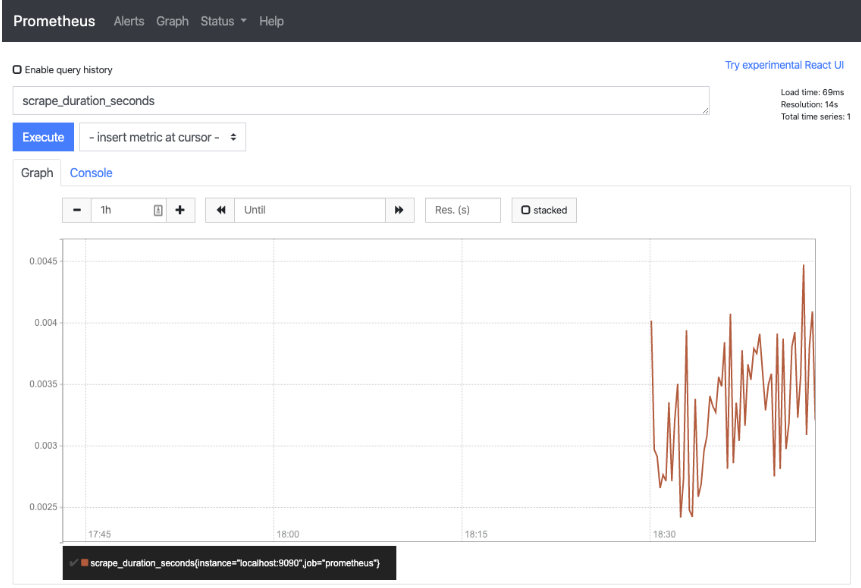
When changing to view the graph of these queries you start to see what may be possible within this time series DB.

prom-search3

Update and Add Network URLs to the Prometheus Config

Now the configuration will get updated to poll two hosts that have SNMP working on it. You see that the http:// and /metrics portions are removed. If not supplied these are applied by default. The prometheus_config.yml file will now look like below:

global:
  scrape_interval: 15s

scrape_configs:
  - job_name: 'prometheus'
    scrape_interval: 5s
    static_configs:
      - targets: ['localhost:9090']

  - job_name: 'snmp'
    scrape_interval: 60s
    static_configs:
      - targets:
        - 'jumphost.create2020.ntc.cloud.tesuto.com:9012'
        - 'jumphost.create2020.ntc.cloud.tesuto.com:9001'

Prometheus PromQL SNMP Example

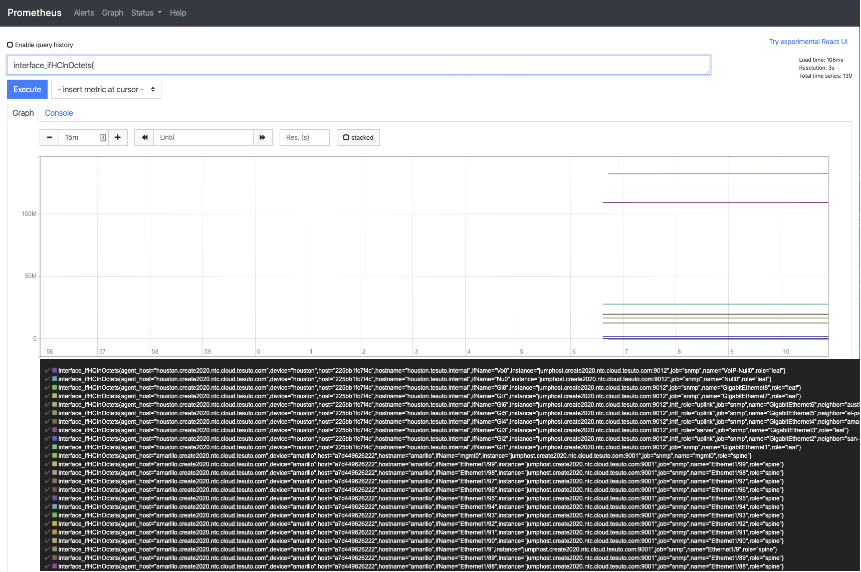
After updating the Prometheus configuration and starting the Prometheus server you can now start to get SNMP data into the graph form. Now updating the PromQL to query for interface_ifHCInOctets you can start to see what the data is that Prometheus is getting from the SNMP data that Telegraf is presenting.

prom-octets1
prom-octets2
prom-octets3

This is all nice, but it is hardly a system that will have a lot of graphs and be something to present to others. This is the role that Grafana will play as a graphing engine.

Grafana

Download and Install Grafana

sudo apt-get install -y adduser libfontconfig1
wget https://dl.grafana.com/oss/release/grafana_6.6.2_amd64.deb
sudo dpkg -i grafana_6.6.2_amd64.deb
josh@prometheus_demo:~$ wget https://dl.grafana.com/oss/release/grafana_6.6.2_amd64.deb
--2020-03-15 19:21:08--  https://dl.grafana.com/oss/release/grafana_6.6.2_amd64.deb
Resolving dl.grafana.com (dl.grafana.com)... 2a04:4e42:3b::729, 151.101.250.217
Connecting to dl.grafana.com (dl.grafana.com)|2a04:4e42:3b::729|:443... connected.
HTTP request sent, awaiting response... 200 OK
Length: 63232320 (60M) [application/x-debian-package]
Saving to: ‘grafana_6.6.2_amd64.deb’

grafana_6.6.2_amd64.deb                     100%[==========================================================================================>]  60.30M  19.8MB/s    in 3.1s

2020-03-15 19:21:12 (19.8 MB/s) - ‘grafana_6.6.2_amd64.deb’ saved [63232320/63232320]

josh@prometheus_demo:~$ sudo dpkg -i grafana_6.6.2_amd64.deb
Selecting previously unselected package grafana.
(Reading database ... 67127 files and directories currently installed.)
Preparing to unpack grafana_6.6.2_amd64.deb ...
Unpacking grafana (6.6.2) ...
Setting up grafana (6.6.2) ...
Adding system user `grafana' (UID 111) ...
Adding new user `grafana' (UID 111) with group `grafana' ...
Not creating home directory `/usr/share/grafana'.
### NOT starting on installation, please execute the following statements to configure grafana to start automatically using systemd
 sudo /bin/systemctl daemon-reload
 sudo /bin/systemctl enable grafana-server
### You can start grafana-server by executing
 sudo /bin/systemctl start grafana-server
Processing triggers for systemd (237-3ubuntu10.39) ...
Processing triggers for ureadahead (0.100.0-21) ...

Enable Grafana to Start on Boot and Start Grafana Server

 sudo /bin/systemctl daemon-reload
 sudo /bin/systemctl enable grafana-server
 sudo /bin/systemctl start grafana-server
josh@prometheus_demo:~$ sudo /bin/systemctl daemon-reload
josh@prometheus_demo:~$ sudo systemctl enable grafana-server
Synchronizing state of grafana-server.service with SysV service script with /lib/systemd/systemd-sysv-install.
Executing: /lib/systemd/systemd-sysv-install enable grafana-server
Created symlink /etc/systemd/system/multi-user.target.wants/grafana-server.service → /usr/lib/systemd/system/grafana-server.service.
josh@prometheus_demo:~$ sudo systemctl start grafana-server

Verify Grafana is Running

I like to verify that Grafana is in fact running by checking for the listening ports. You can do this by using the ss -lt command to get the output, and checking that there is a *:3000 entry in the output. TCP/3000 is the default port for Grafana.

josh@prometheus_demo:~$ ss -lt
State                 Recv-Q                 Send-Q                                   Local Address:Port                                     Peer Address:Port
LISTEN                0                      128                                      127.0.0.53%lo:domain                                        0.0.0.0:*
LISTEN                0                      128                                            0.0.0.0:ssh                                           0.0.0.0:*
LISTEN                0                      128                                               [::]:ssh                                              [::]:*
LISTEN                0                      128                                                  *:3000                                                *:*

Verify – Navigate to the Default Page

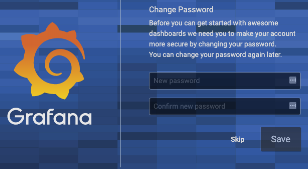
The default login is admin/admin. When you first log in you will be prompted for a new admin password.

grafana-login1
grafana-login2

Getting to the Graphing

Re-start Prometheus

Before you add in additional data sources that are needed, you need to restart the service on your Linux host.

josh@prometheus_demo:~$ ./prometheus --config.file=prometheus_config.yml

Add Data Source to Grafana

Now that you are in you need to add a data source for Grafana. In this demo you are going to see us add a localhost connection to Prometheus. Going back to the web interface on the main menu that you started into you can click on Add datasource.

grafana-datasource-1

In this instance of 6.6.x Grafana had Prometheus on the top of the list. Navigate to where you see Prometheus and click select.

grafana-datasource-2

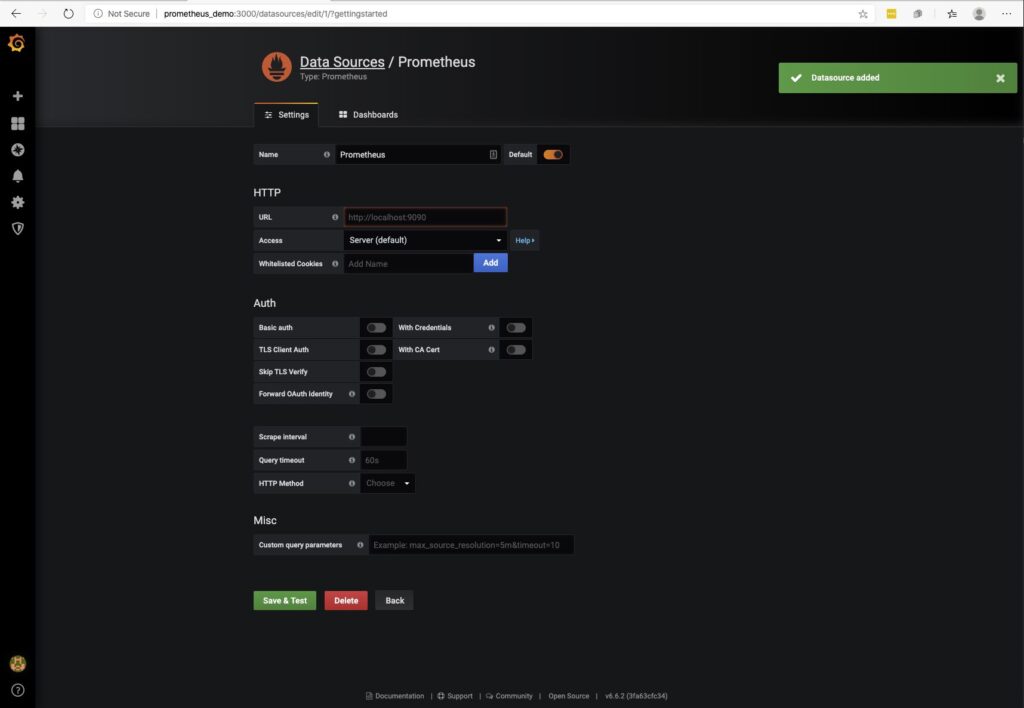
The data source will bring you to a configuration screen.

grafana_prometheus_start

Here make the following changes:

Field Changes from Default

FieldSetting
URLhttp://localhost:9090

Once modified, click Save and Test to test and verify connectivity to the DB. If you setup a different host as the Prometheus server, then you would enter the hostname/IP address combination that corresponds to the Prometheus host.

grafana-datasource-4

When you get the message Data source is working you have successfully connected.

Grafana Dashboard Creation

Now navigate to the left hand navigation and select the plus icon, select Dashboard to get a new dashboard created.

grafana-menu-create-dash
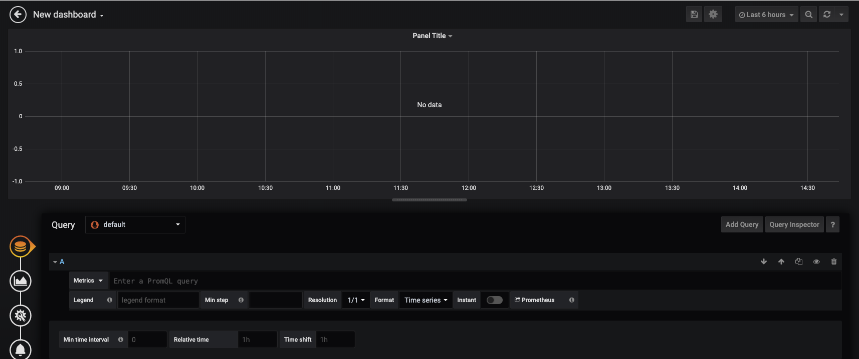
grafana-add-query

You get a new panel page, and then select Add Query.

grafana-graph-create

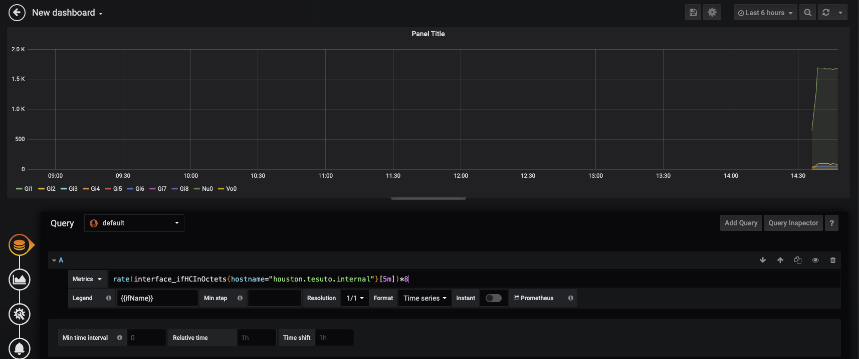
Once on the new query page we will set a search to get the Inbound utilization on an interface. Set up the query as follows:

grafana-graph-fill

Note that the queries used on this Grafana example are going to be of PromQL – the Prometheus Query Langague. In this graphic, the {{ifName}} is telling Grafana that ifName is the variable to lookup to add to the legend for each measurement.

If your data source for Grafana is Graphite or InfluxDB, you would use the same query language used by the database system of the data source.

To explain what each item is doing to help generate your own queries. Given the following PromQL query:

rate(interface_ifHCInOctets{hostname="houston.tesuto.internal"}[2m])*8

Rate

The rate query from Prometheus covers the rate of change. With SNMP, the number gathered for Interface utilization is an increasing number, not a rate. So the Prometheus system needs to calculate what that rate is. The [2m] indicates to calculate the per-second rate measured over the past 2 minutes.

Metric Name

The metric name in the query is interface_ifHCInOctets. This is the metric that was taken a look at earlier in the post. This is the exact measurement.

Query Tags

The tags in the search is to help filter out what is being searched upon to give the proper graph. In this instance you will only see interfaces on the device hostname houston.tesuto.internal.

Math

In the query there is a *8 at the end. This is to convert the measurement from octets as defined in the metric over to bits. An octet is 8 bits, thus the multiplication by 8.

Visualization Changes

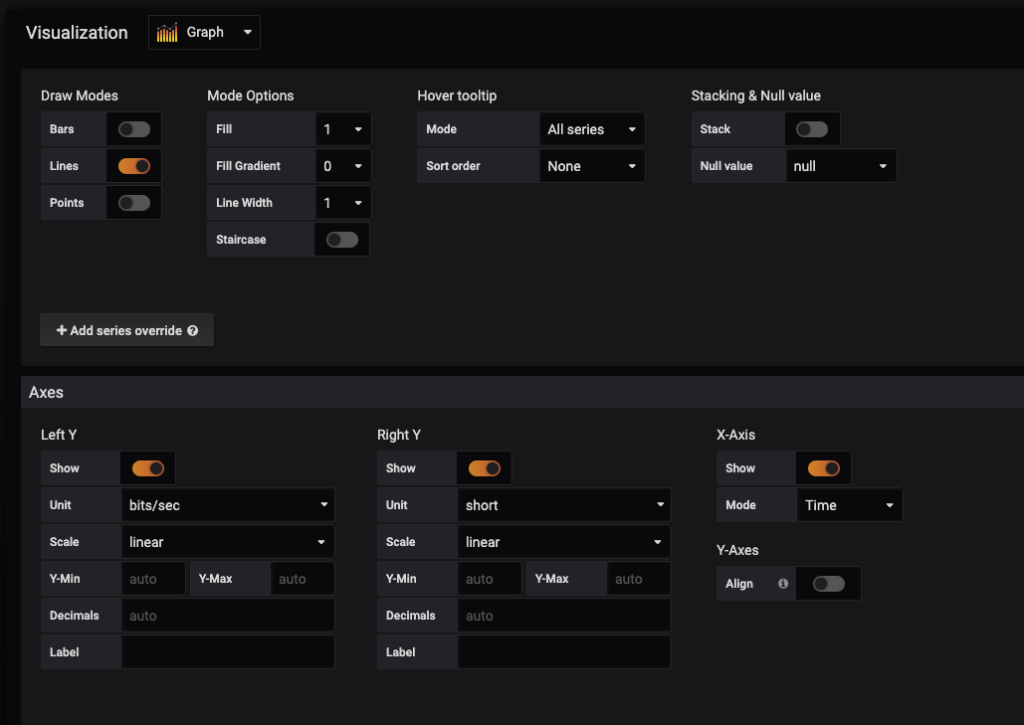
Now we’re going to make a few more updates on the graph. Here are the changes being made on the Visualization section (2nd of four items on the left hand side of the panel configuration). Specifically, the changes being made are in the Axis subsection. You can play around with settings in the upper section to get some changes made to the graphs.

grafana_visualization_customization
grafana_legend
SettingModification
Left Y: Unitbits/sec (under Data Rate)
Legend Values: MinChecked
Legend Values: AvgChecked
As TableChecked
To RightChecked

General Section Changes

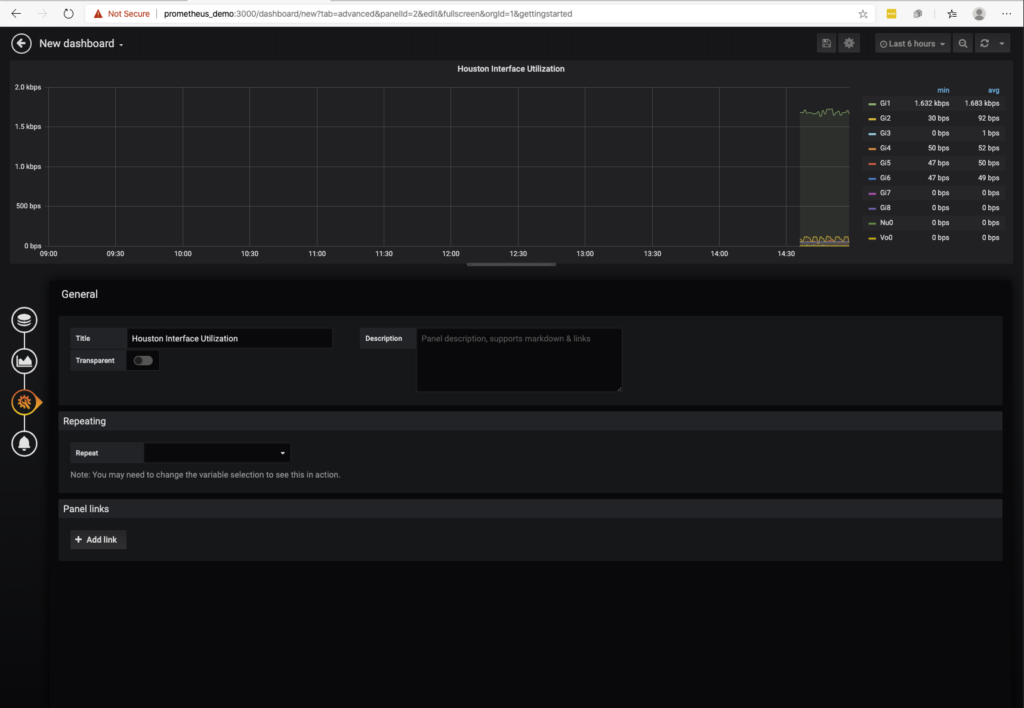
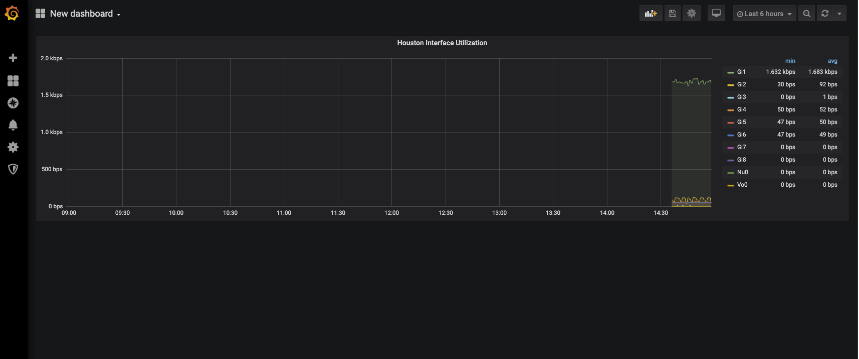
Here is where you can set the title of the panel. Let’s change that to Houston Interface Utilization. After making the update, click on the upper left to go back to the dashboard.

grafana_general

The panel size can be adjusted in size by dragging the corners as you see fit to make your dashboard.

grafana-graph-completed

Update Dashboard Name

On the main dashboard page to change the name on the dashboard select the Save icon on the upper right. This will give you a prompt with a New Name and Folder to save the dashboard into. This allows you to add heirarchy to your dashboarding system.

update_name

Important Note – if you make changes you do need to save the changes. Grafana as of this version does not save changes after a change. It does require you to save your changes once you are done making changes.

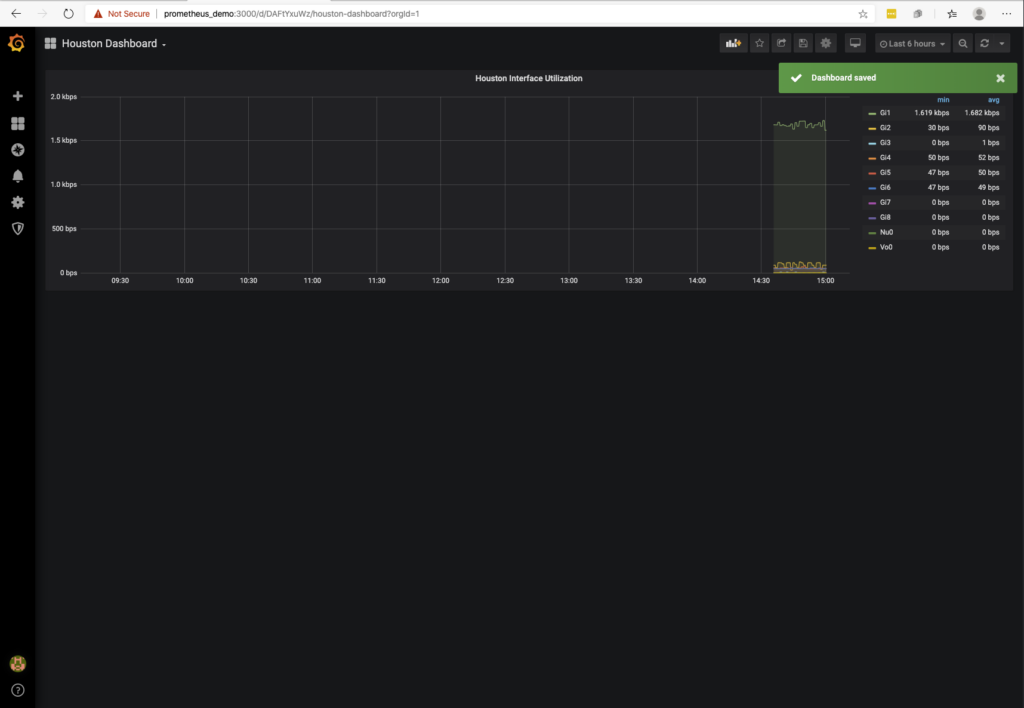
After you save the changes you get a visual confirmation that the changes are saved and that you now have a title on dashboard!

dashboard_saved

Conclusion

Hopefully this will help on your journey! In a follow-up post I will take a look at a few more capabilities within Telegraf, Prometheus, and Grafana.

  • How to gather streaming data with gNMI
  • Telegraf Tags
  • Transforming data with Telegraf
  • Prometheus queries
  • Grafana Tables
  • Grafana Thresholds & Alerts

To continue on in the journey, take a look at Network Telemetry – Advancing Your Dashboards and monitoring websites.

-Josh


ntc img
ntc img

Contact Us to Learn More

Share details about yourself & someone from our team will reach out to you ASAP!

How to Monitor Your VPN Infrastructure with Netmiko, NTC-Templates, and a Time Series Database

Blog Detail

With many people being asked to work from home, we have heard several customers looking to enhance the visibiility and monitoring of their VPN infrastructure. In this post I will show you how you can quickly collect information from your Cisco ASA firewall leveraging Netmiko, NTC-Templates (TextFSM), combined with Telegraf/Prometheus/Grafana. The approach would work on other network devices, not just Cisco ASAs. Considering the recent demand for ASA information, we will use this as an example.

Here is what the data flow will look like:

data_flow
  • Users will connect to the ASA for remote access VPN services
  • Python: Collects information from the device via CLI and gets structured data by using a NEW template to parse the CLI output. This is presented via stdout in Influx data format
  • Telegraf: Generic collector that has multiple plugins to ingest data and that can send data to many databases out there.
    • INPUT: Execute the Python script every 60s and read the results from stdout.
    • OUTPUT: Expose the data over HTTP in a format compatible with Prometheus
  • Prometheus: Time Series DataBase (TSDB). Collects the data from Telegraf over HTTP, stores it, and exposes an API to query the data
  • Grafana: Solution to build dashboards, natively support Prometheus to query data.

An alternative to creating this Python script, you could have looked at using the Telegraf SNMP plugin as well. An SNMP query would be quicker than using SSH and getting data if you want basic counts. In this you will see that you can get custom metrics into a monitoring solution without having to use only SNMP.

Execution of Python

If executing just the Python script without being executed by Telegraf, this is what you would see:

$ python3 asa_anyconnect_to_telegraf.py --host 10.250.0.63
asa connected_users=1i,anyconnect_licenses=2i

This data will then get transformed by Telegraf into an output that is usable by Prometheus. It is possible to remove the requirement for Telegraf and have Python create the Prometheus Metrics. We wanted to keep the Python execution as simple as possible. To use the prometheus_client library check out their Github page.

Python Script

In this post we have the following components being used:

  • Python:
    • Netmiko to SSH into an ASA, gather command output, and leverage the corresponding NTC Template
    • NTC Template which is a TextFSM template for parsing raw text output into structured data
  • Telegraf: Takes the output of the Python script as an input and translates it to Prometheus metrics as an output

Python Requirements

The Python script below will have the following requirements set up before hand:

  • ENV Variables for authentication into the ASA
    • ASA_USER: Username to log into the ASA
    • ASA_PASSWORD: Password to log into the ASA
    • ASA_SECRET (Optional): Enable password for the ASA, if left undefined will pick up the ASA_PASSWORD variable
  • Required Python Packages:
    • Netmiko: For SSH and parsing
    • Click: For argument handling – to get the hostname/IP address of the ASA
  • Github Repository for NTC-Templates setup in one of two ways:
    • Cloned to user home directory cd ~ and git clone https://github.com/networktocode/ntc-templates.git
    • NET_TEXTFSM Env variable set NET_TEXTFSM=/path/to/ntc-templates/templates/

The specific template is the newer templatefor cisco asa show vpn-sessiondb anyconnect introduced March 18, 2020

Python Code

There are two functions used in this quick script:

"""
(c) 2020 Network to Code
Licensed under the Apache License, Version 2.0 (the "License").
You may not use this file except in compliance with the License.
You may obtain a copy of the License at
http: // www.apache.org/licenses/LICENSE-2.0
Unless required by applicable law or agreed to in writing, software
distributed under the License is distributed on an "AS IS" BASIS,
WITHOUT WARRANTIES OR CONDITIONS OF ANY KIND, either express or implied.
See the License for the specific language governing permissions and
limitations under the License.

Python application to gather metrics from Cisco ASA firewall and export them as a metric for Telegraf
"""
from itertools import count
import os
import sys
import re
import click
from netmiko import ConnectHandler

def print_influx_metrics(data):
    """
    The print_influx_metrics function takes the data collected in a dictionary format and prints out
    each of the necesary components on a single line, which matches the Influx data format.

    Args:
        data (dictionary): Dictionary of the results to print out for influx
    """
    data_string = ""
    cnt = count()
    for measure, value in data.items():
        if next(cnt) > 0:
            data_string += ","
        data_string += f"{measure}={value}i"

    print(f"asa {data_string}")

    return True


def get_anyconnect_license_count(version_output):
    """
    Searches through the `show version` output to find all instances of the license and gets the
    output into integers to get a license count.

    Since there could be multiple ASAs in a cluster or HA pair, it is necessary to gather multiple data
    points for the license count that the ASAs are licensed for. This function uses regex to find all of
    the instances and returns the total count based on the `show version` command output.  

    Args:
        version_output (String): Output from Cisco ASA `show version`
    """
    pattern = r"AnyConnect\s+Premium\s+Peers\s+:\s+(\d+)"
    re_list = re.findall(pattern, version_output)

    total_licenses = 0
    for license_count in re_list:
        total_licenses += int(license_count)

    return total_licenses


# Add parsers for output of data types
@click.command()
@click.option("--host", required=True, help="Required - Host to connect to")
def main(host):
    """
    Main code execution
    """
    # Get ASA connection Information
    try:
        username = os.environ["ASA_USER"]
        password = os.environ["ASA_PASSWORD"]
        secret = os.getenv("ASA_SECRET", os.environ["ASA_PASSWORD"])
    except KeyError:
        print("Unable to find Username or Password in environment variables")
        print("Please verify that ASA_USER and ASA_PASSWORD are set")
        sys.exit(1)

    # Setup connection information and connect to host
    cisco_asa_device = {
        "host": host,
        "username": username,
        "password": password,
        "secret": secret,
        "device_type": "cisco_asa",
    }
    net_conn = ConnectHandler(**cisco_asa_device)

    # Get command output for data collection
    command = "show vpn-sessiondb anyconnect"
    command_output = net_conn.send_command(command, use_textfsm=True)

    # Check for no connected users
    if "INFO: There are presently no active sessions" in command_output:
        command_output = []

    # Get output of "show version"
    version_output = net_conn.send_command("show version")

    # Set data variable for output to Influx format
    data = {"connected_users": len(command_output), "anyconnect_licenses": get_anyconnect_license_count(version_output)}

    # Print out the metrics to standard out to be picked up by Telegraf
    print_influx_metrics(data)


if __name__ == "__main__":
    main()

Telegraf

Now that the data is being output via the stdout of the script, you will need to have an application read this data and transform it. This could be done in other ways as well, but Telegraf has this function built in already.

Telegraf will be setup to execute the Python script every minute. Then the output will be transformed by defining the output.

Telegraf Configuration

The configuration for this example is as follows:

# Globally set tags that shuld be set to meaningful tags for searching inside of a TSDB
[agent]
hostname = "demo"

[global_tags]
  device = "10.250.0.63"
  region = "midwest"

[[inputs.exec]]
  ## Interval is how often the execution should occur, here every 1 min (60 seconds)
  interval = "60s"
  # Commands to be executed in list format
  # To execute against multiple hosts, add multiple entries within the commands
  commands = [
      "python3 asa_anyconnect_to_telegraf.py --host 10.250.0.63"
  ]

  ## Timeout for each command to complete.
  # Tests in lab environment next to the device with local authentication has been 6 seconds
  timeout = "15s"

  ## Measurement name suffix (for separating different commands)
  name_suffix = "_parsed"

  ## Data format to consume.
  ## Each data format has its own unique set of configuration options, read
  ## More about them here:
  ## https://github.com/influxdata/telegraf/blob/master/docs/DATA_FORMATS_INPUT.md
  data_format = "influx"

# Output to Prometheus Metrics format
# Define the listen port for which TCP port the web server will be listening on. Metrics will be
# available at "http://localhost:9222/metrics" in this instance.
# There are two versions of metrics and if `metric_version` is omitted then version 1 is used
[[outputs.prometheus_client]]
  listen = ":9222"
  metric_version = 2

Telegraf Output Example

Here is what the metrics will look like when exposed, without the default Telegraf information metrics.

# HELP asa_parsed_anyconnect_licenses Telegraf collected metric
# TYPE asa_parsed_anyconnect_licenses untyped
asa_parsed_anyconnect_licenses{device="10.250.0.63",host="demo",region="midwest"} 2
# HELP asa_parsed_connected_users Telegraf collected metric
# TYPE asa_parsed_connected_users untyped
asa_parsed_connected_users{device="10.250.0.63",host="demo",region="midwest"} 1

There are two metrics of anyconnect_licenses and connected_users that will get scraped. There are a total of 2 Anyconnect licenses available on this firewall with a single user connected. This can now get scraped by the Prometheus configuration and give insight to your ASA Anyconnect environment.

Prometheus Installation

There are several of options for installing a Prometheus TSDB (Time Series DataBase)including:

  • Precompiled binaries for Windows, Mac, and Linux
  • Docker images
  • Building from source

To get more details on installation options take a look at the Prometheus Github page.

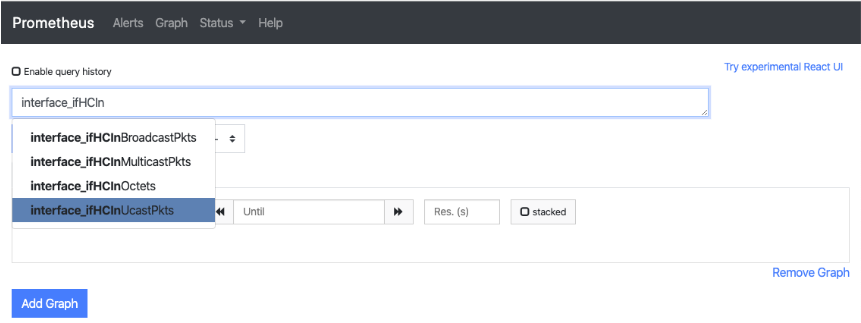
Once installed you can navigate to the Prometheus API query page by going to http://<prometheus_host>:9090. You will then be presented with a search bar. This is where you can start a query for your metric that you wish to graph, such as start typing asa. Prometheus will help with an autocomplete set of options in the search bar. Once you have selected what you wish to query you can select Execute. This will give you a value at this point. To see what the query looks like over time you can select Graph next to the world console to give you a graph over time. Grafana will then use the same query language to add a graph.

Once up and running, you add your Telegraf host to the scraping configuration and Prometheus will start to scrape the HTML page provided and add the associated metrics into its TSDB.

A good video tutorial for getting started with Prometheus queries with network equipment can be found on YouTube from NANOG 77

Grafana Installation

Grafana is the dashboarding component of choice in the open source community. Grafana is able to use several sources to create graphs including modern TSDBs of InfluxDB and Prometheus. With the latest release, Grafana can even use Google Sheets as a datasource.

As you get going with Grafana there are pre-built dashboards available for download.

TYou will want to download Grafana to get started. There are several installation methods available on their download page including options for:

  • Linux
  • Windows
  • Mac
  • Docker
  • ARM (Raspberry Pi)

The Prometheus website has an article that is helpful for getting started with your own Prometheus dashboards.

If the video just above this link does not show up, you can see the video on the Network to Code YouTube.

In the next post you can see how to monitor websites and DNS queries will include how to alert using this technology stack.

-Josh


ntc img
ntc img

Contact Us to Learn More

Share details about yourself & someone from our team will reach out to you ASAP!