Introduction to PromQL

Blog Detail

Time series databases and their query languages are tools with increasing popularity for a Network Automation Engineer. However, sometimes these tools may be overlooked by network operators for more “pressing” day-to-day workflow automation. Time series databases offer valuable network telemetry that will reveal important insights for network operations, such as security breaches, network outages, and slowdowns that degrade the user experience.

In this post, we will review the Prometheus Query Language (PromQL) to demonstrate the value and capabilities of processing time series. This review will offer use cases of PromQL for network engineers and data scientists.

What is Prometheus?

Prometheus is an open source systems monitoring and alerting toolkit. As you can see in the figure below, the heart of Prometheus includes a Time Series Database (TSDB) and the PromQL Engine. Exporters run locally on monitored hosts and export local metrics related to device health, such as CPU and memory utilization, and services, such as HTTP. The alert mechanism implemented with Prometheus, triggers alerts based on events and predefined thresholds. Prometheus has a web UI that we will be using in the examples of this post. In addition, the Prometheus measurements can be visualized using Grafana dashboards.
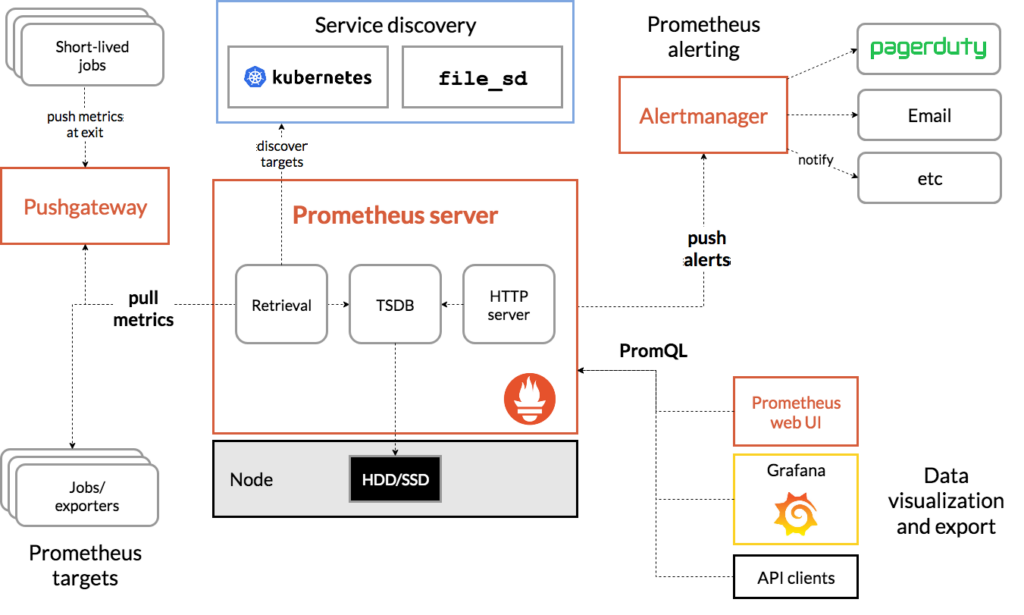
prometheus

Source: Prometheus Overview

What is a TSDB?

In simple words, it is a database that stores time series. Then, what is a time series? It is a set of time-stamps and their corresponding data. A TSDB is optimized to store these time series data efficiently, measure changes, and perform calculations over time. PromQL is the language that was built to retrieve data from the Prometheus TSDB. In networking, this could mean tracking the state of an interface or bandwidth utilization over time.

Why PromQL?

There are several other TSDBs, one of the most well known is InfluxDB. Both Prometheus TSDB and InfluxDB are excellent tools for telemetry and time series data manipulation. PromQL’s popularity has been growing fast because it is a comprehensive language to consume time series data. Multiple other solutions are starting to support PromQL, such as NewRelic that recently added support for PromQL and Timescale with Promscale.

Now that we have all the prerequisite knowledge we can dive deep into the PromQL data model and dissect language queries.

Prometheus Data Model

The first part of the Prometheus data model is the metric name. A metric name is uniquely identified, and it indicates what is being measured. A metric is a dimension of a specific feature. Labels are the second part of the data model. A label is a key-value pair that differentiates sub-dimensions in a metric.

Think of a metric, ex. interface_in_octets, as an object with multiple characteristics, ex., device_role. As you can see in the figure below, each label can pick a value for this characteristic, i.e. device_role="leaf". The combination of metrics and labels return a time series identifier, i.e., a list of tuples that provide the (timestamp, value) of the object with the specific characteristic. The timestamps are given in Unix time, milliseconds precision and the values that correspond to them are floating point type.

As a Network Automation Engineer you can think of many examples of metrics, such as interface_speedbgp_hold_timepackets_dropped, etc. All these metrics can be characterized by a variety of labels, such as device_platformhostinstanceinterface_name etc.

prometheus-data-model

With that data model in mind, let us next dissect a query in PromQL.

The anatomy of a query

The simplest form of a PromQL query may include just a metric. This query returns multiple single value vectors, as you can see below. All the applicable labels and value combinations that these labels can be assigned are given as a result of this simple query.
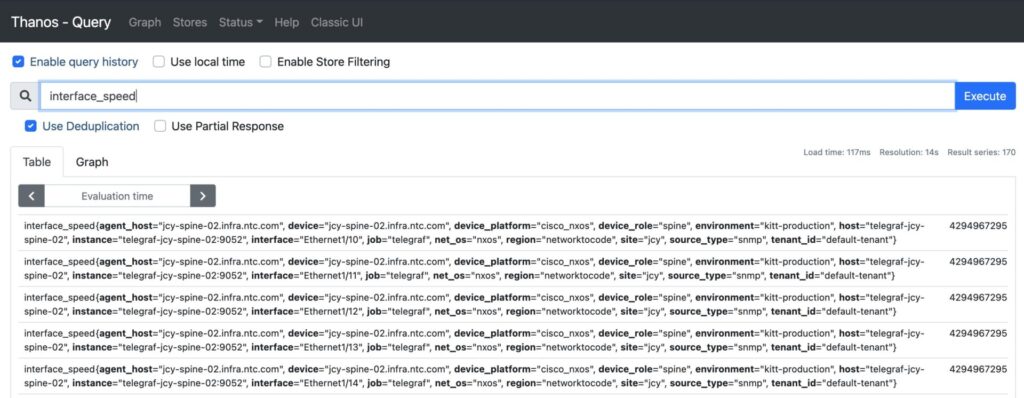
query-metric

Metrics

What kind of metrics does PromQL support? There are four kinds of metrics:

  1. Counters: these are metrics that can only increase, for example: interface counters, API call counters, etc.
  2. Gauges: the values of these metrics can go up and down, for example: bandwidth, latency, packets dropped, etc. Gauges and counters are useful for network engineers because they can measure already existent features of a system.
  3. Summaries: this metric is useful to data scientists and if your application includes data analytics. To use this metric you need have control of what you can measure and drill into additional details. A summary metric aggregates thousands of events to one metric. Specifically it counts observations and sums all the observed values. It can also calculate quantiles of these values. If you have an application that is being monitored, you can use the summaries for API request durations.
  4. Histograms: this is another metric that is more useful to a data scientist than a network engineer. Histogram metrics can be defined as summaries that are “bucketized”. Specifically they count observations and place them in configurable buckets. A histogram can be used to measure response sizes on an application.

Label Filtering

Now that we know what kinds of metrics we can include in our query, let us review how we can filter the query to retrieve more specific and meaningful results. This can be done with label filtering that includes the following operations:

# equal, returns interface speed for device with name jcy-bb-01
interface_speed{device="jcy-bb-01.infra.ntc.com"}
# not equal, returns the opposite of the above query
interface_speed{device!="jcy-bb-01.infra.ntc.com"}
# regex-match, matches interface Ethernet{1, 2, 3, 4, 5, 6, 7}
interface_speed{interface=~"Ethernet1/[1-7]"}
# not regex-match, returns the opposite of the above query
interface_speed{interface!~"Ethernet1/[1-7]"}

Not only can you use the equal and not equal signs to filter your queries, but you can filter using regular expressions. To learn more about regular expressions for network engineers, check our previous blog.

Functions

One of my favorite parts of PromQL are the functions that can manipulate the time series identifiers. Below, I include an example of the function rate(), that is useful for network metrics, and the function predict_linear(), that is useful if you perform data analytics.

How fast does a counter change?

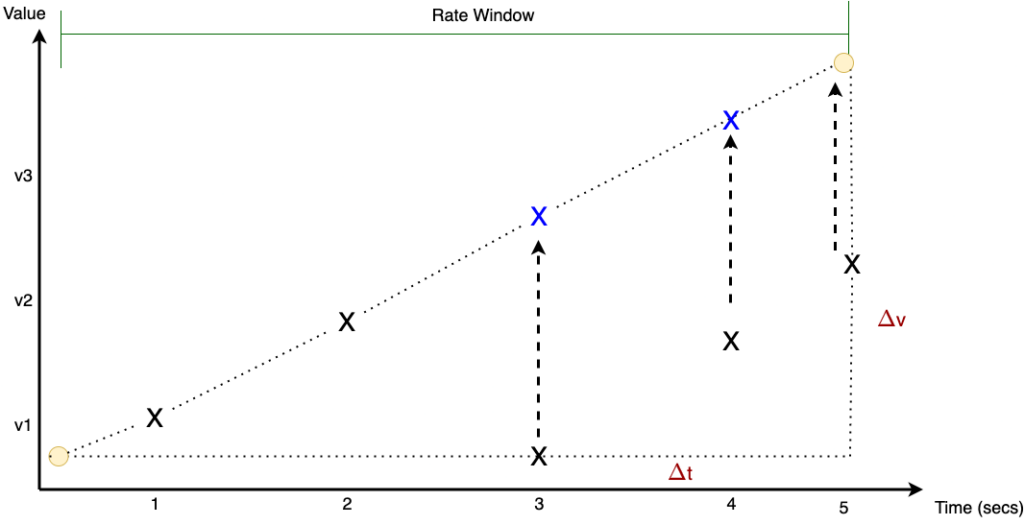
The function rate() can be used with counter metrics to demonstrate how fast a counter increases. Specifically, it calculates the per second increase for a time period. This is a useful function to the network engineer, since counters are a common metric applied in networks. For example packet counting, interface octets counting are counters and the rate() function offers useful insights on how these counters increase.

#per second increase of counter averaged over 5 mins
rate(interface_in_octets{device_role="leaf"}[5m])

The next figure will help you understand the details of how the rate() function is calculated. The interval $\Delta$t indicates the time interval during which we want to calculate the rate. The X marks indicate the per second samples that are used to calculate multiple rates per second. The rate() function averages these calculations during the interval $\Delta$t. If the counter is reset to 0, the rate() function will extrapolate the sample as can be seen with the blue X marks.
rate

Instance vs. Range Vectors

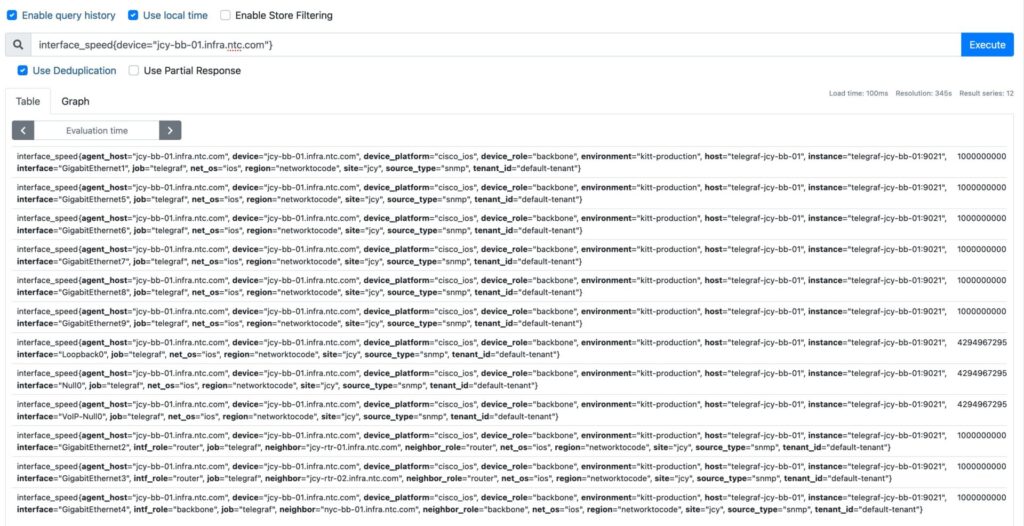
You probably have noticed that the example of the rate() function above, uses a different type of syntax. Specifically it identifies the time series during an interval, from the example above the interval is 5 minutes ([5m]). This results to a range vector, where the time-series identifier returns the values for a given period, in this case 5 minutes. On the other hand, an instance vector returns one value, specifically the single latest value of a time series. The figures below shows the differences in the results of an instance vector versus a range vector.

#instance vector
interface_speed{device="jcy-bb-01.infra.ntc.com"}
query-instance-vector
#range vector
interface_speed{device="jcy-bb-01.infra.ntc.com"}[5m]
query-range-vector

In the first figure, only one value per vector is returned whereas in the second, multiple values that span in the range of 5 minutes are returned for each vector. The format of these values is: value@timestamp.

Offsets

You may be wondering: all of this is great, but where is the “time” in my “time-series”? The offset part of the query can retrieve data for a specific time interval. For example:

# interface speed status for the past 24 hrs
rate(interface_in_octets{device="jcy-bb-01.infra.ntc.com"}[5m] offset 24h)

Here we combine the function rate(), that samples the interface_in_octets counter every second for five minutes, with offset that gives us historical data for the past 24 hours.

Can I predict the next 24 hours?

Of course! PromQL provides the function predict_linear(), a simple machine learning model that predicts the value of a gauge in a given amount of time in the future, by using linear regression. This function is of more interest to a data scientist that wants to create forecasting models. For example, if you want to predict the disk usage in bytes within the next hour based on historic data, you would use the following query:

#predict disk usage bytes in an hour, using the last 15 mins of data
predict_linear(demo_disk_usage_bytes{job="demo"}[15m], 3600)

Linear regression fits a linear function to a set of random data points. This is achieved by searching for all possible values for the variables a, b that define a linear function f(x)=ax+b. The line that minimizes the mean Euclidean distance of all these data points is the result of the linear regression model, as you can see in the image below:

linear-regression

Aggregation

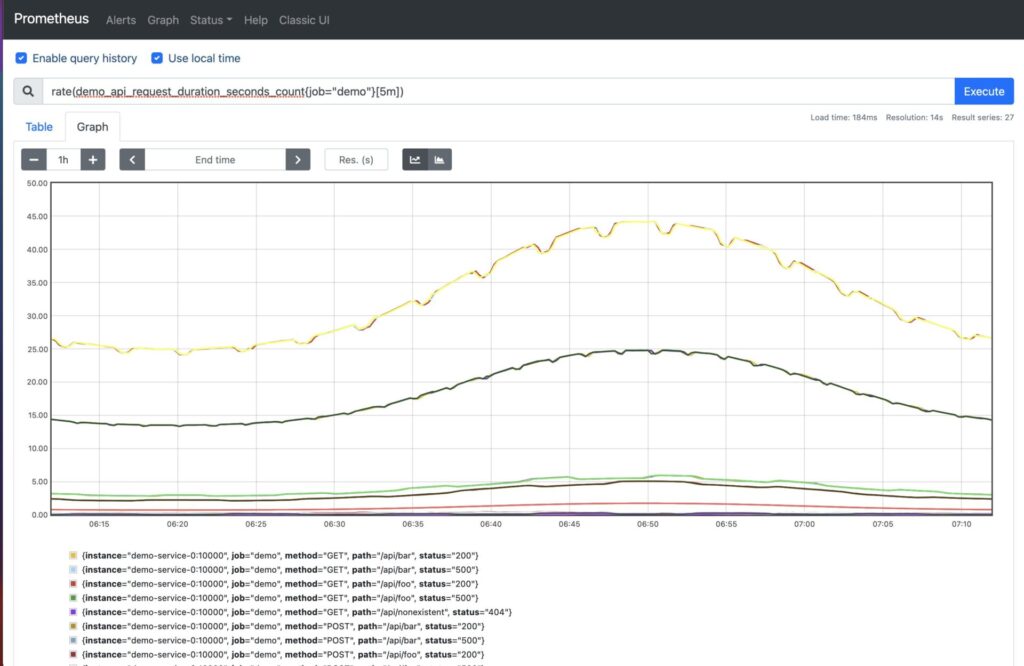
PromQL queries can be highly dimensional. This means that one query can return a set of time series identifiers for all the combinations of labels, as you can see below:

#multi-dimensional query
rate(demo_api_request_duration_seconds_count{job="demo"}[5m])
multi-dimensional

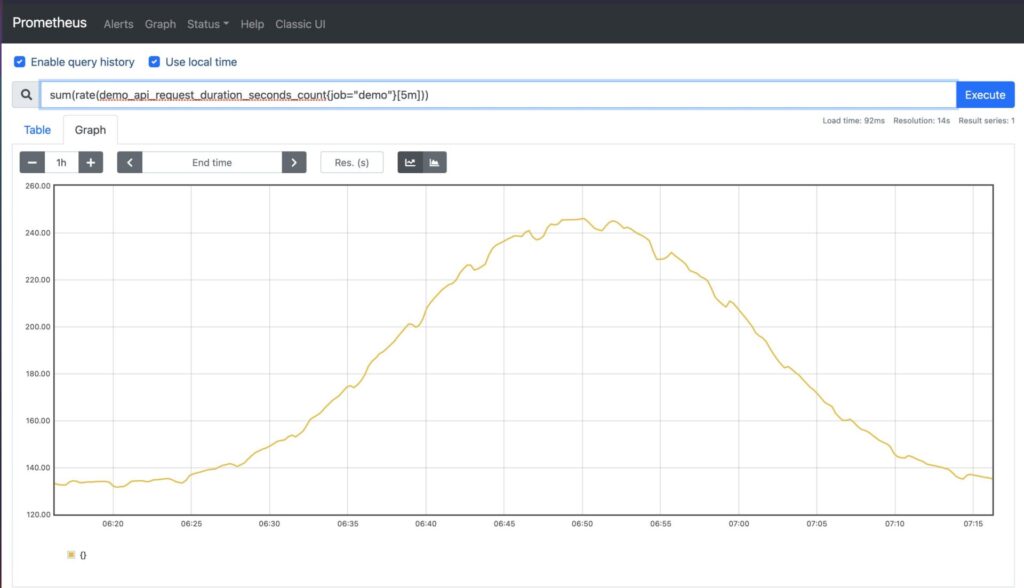
What if you want to reduce the dimensions to a more meaningful result, for example the sum of all the API request durations in seconds? This would result in a single-dimension query that is the result of adding multiple instance vectors together:

#one-dimensional query, add instance vectors
sum(rate(demo_api_request_duration_seconds_count{job="demo"}[5m]))
one-dimensional

You may choose to aggregate over specific dimensions using labels and the function by(). In the example below, we perform a sum over all instances, paths, and jobs. Note the reduction of the number of vectors returned:

# multi-dimensional query - by()
sum by(instance, path, job) (rate(demo_api_request_duration_seconds_count{job="demo"}[5m]))
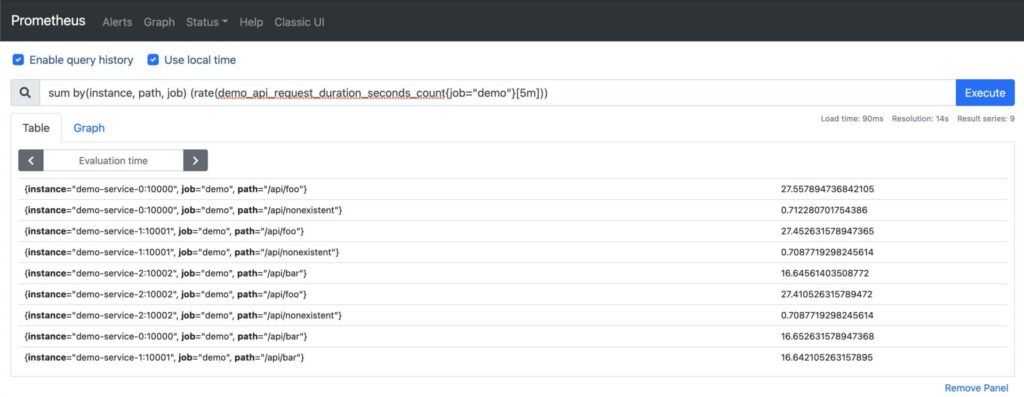
sum-by

We can perform the same query excluding labels using the function without():

sum without(method, status) (rate(demo_api_request_duration_seconds_count{job="demo"}[5m]))

This results to the same set of instance vectors:
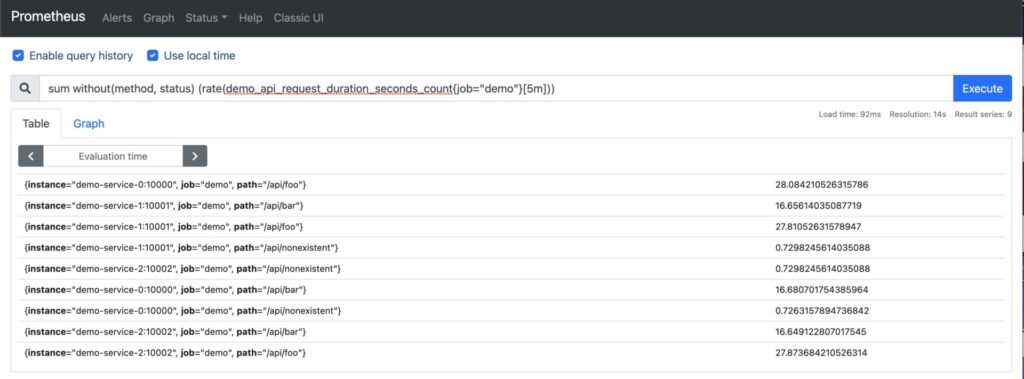
sum-without

Additional aggregation over dimensions can be done with the following functions:

  • min(): selects the minimum of all values within an aggregated group.
  • max(): selects the maximum of all values within an aggregated group.
  • avg(): calculates the average (arithmetic mean) of all values within an aggregated group.
  • stddev(): calculates the standard deviation of all values within an aggregated group.
  • stdvar(): calculates the standard variance of all values within an aggregated group.
  • count(): calculates the total number of series within an aggregated group.
  • count_values(): calculates number of elements with the same sample value.

Useful Resources


Conclusion

Thank you for taking this journey with me, learning about the time series query language, PromQL. There are many more features to this language such as arithmetic, sorting, set functions etc. I hope that this post has given you the opportunity to understand the basics of PromQL, see the value of telemetry and TSDBs, and that it has increased your curiosity to learn more.

-Xenia


ntc img
ntc img

Contact Us to Learn More

Share details about yourself & someone from our team will reach out to you ASAP!

How InfluxDB Enables IoT Sensor Monitoring of Aquariums

Blog Detail

This blog post was originally published on the InfluxData blog on September, 8 2020 and can be found here. Interested in learning more? Reach out to us today to get the conversation started.

I recently spoke with Jeremy White who is using InfluxDB to monitor his aquariums. By collecting IoT sensor data, he has been able to better understand his 200 gallon salt-water aquarium full of fish and coral. The entire project can be found on GitHub.

Caitlin: Tell us about yourself and your career.

Jeremy: I’m a Senior Network Automation Consultant at Network to Code, and my background is in networking engineering. Network to Code is an industry leader in network automation. I taught myself Python and Ansible, and I have built a full network automation framework. In addition to Python and Ansible, I’m familiar with Django REST frameworks, Flask and NetBox. I’m starting to dive into telemetry and analytics.

Caitlin: How did you learn about InfluxDB?

Jeremy: I have previously used InfluxDB at work. Some colleagues have used InfluxDB and Telegraf previously to monitor public DNS. They have also used InfluxDB, the purpose-built time series database, to monitor their home networks. Network to Code has implemented InfluxDB for various clients based on their needs. I was impressed with InfluxDB and thought it might be a great way to improve the monitoring of my saltwater aquarium.

Caitlin: Tell us about your aquariums.

Jeremy: I currently have two salt-water aquariums. One is 54 gallons and my new one is 200 gallons. I recently decided to upgrade to the 200 gallon aquarium. It’s definitely going to be a process moving all of my fish and coral to their new home. I need to ensure everything is stable and that it’s working the way I want it to.

I’m growing small polyp stony (SPS) coral. I have Acropora, Monitpora, Catalaphyllia, Lithophyllon, Discosoma, Zoanthus and Briareum corals. Many of these corals are found closer to the surface within coral reefs. They have a calcium-based skeleton with small polyps. These corals can be very vibrant and beautiful. I have a Staghorn coral which is a beautiful highlighter teal-bluish color.

corals_00

Close-up of coral growing in aquarium

Most of my coral is either aquaculture or mariculture. Aquaculture coral is grown in an aquarium or tank with artificial lighting. Mariculture coral is coral cultured in specifically designated farmed areas in the ocean. This means they are not pulling coral from native reefs. I’ve tried to make sure I’m as sustainable as possible. Most of the coral I have originated from Indonesia or Australia. I do have some coral fragments that are from someone who grew them in captivity for over 20 years.

Right now, I have a Coral Beauty Dwarf Angelfish, a Blue Hippo Tang, a Yellow Tang, a Yellow Watchman Goby, three Gladiator Clownfish, an Ocellaris Clownfish, a Copperband Butterflyfish and a Pixie Hawkfish. I also have a bunch of invertebrates including about 20 hermit crabs, roughly 20 snails, a Banded Serpent starfish, a Sand Sifting starfish, an Arrow crab and an Emerald crab.

corals_01

200-gallon saltwater aquarium monitored by InfluxDB

Caitlin: What were some of the challenges you were facing with your aquariums?

Jeremy: I knew I had proper lighting and proper water flow. However, I knew my corals weren’t growing at the rate that I thought I should be observing. There was minimal calcification on the SPS coral. They were alive and surviving, but they weren’t thriving. In addition to lack of growth, the coloration was off. Proper lighting provides the necessary energy for photosynthetic organisms like plants, animals, anemones and coral to survive. Lighting can also impact fish behavior and physiology.

The next aspect is water chemistry: I knew realistically that I was probably only going to check the status of the aquarium once a week. Having a bunch of individual tests that I’d have to run manually wasn’t going to happen as often as I’d like. I knew I needed to automate my monitoring solution to ensure I had the most recent accurate data about my aquarium.

It turns out my aquarium environment wasn’t as stable as I thought. Coral can survive in a wide range of water temperatures, and the pH of the water can vary. It’s more important that the levels stay consistent. Coral are very flexible creatures, so they are able to adapt and survive. Frequent fluctuations in their environment, like temperatures and salinity, can be very stressful for coral, and detrimental to their survival and growth.

Within three days of setting everything (my AquaPy controller) up, I started seeing results. I realized there is a two-degree temperature swing from day to night. As I work from home, I know that it isn’t because my house is getting too hot, as the temperature in my home is pretty consistent. A two-degree swing is pretty minimal, but it’s enough to impact the growth and color of my coral. After iterating with my setup (AquaPy), I got the temperature delta down to less than one degree. My tanks hover around the 79-81ºF mark. I want to minimize the difference as much as possible.

Caitlin: Tell us about the IoT monitoring solution you built using InfluxDB.

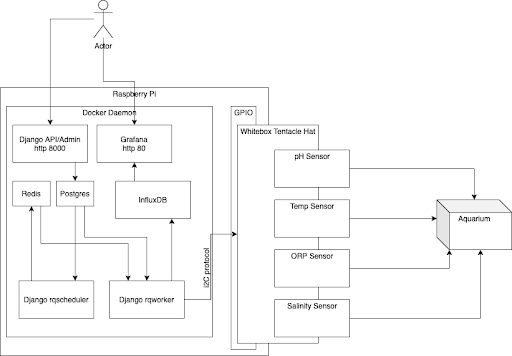
Jeremy: My whole stack is built using containers. I love containers! Whether it’s a work or personal project, If I can containerize it, I do. If there isn’t a prebuilt container, I’ll create one myself. I started off by purchasing sensors from Atlas Scientific. They make the IoT sensors and the small printed circuit board (PCB’s). The PCBs are used to read the data from the sensors using the I2C protocol within Raspberry Pi’s. There’s a company called Whitebox which makes a product called Tentacle T3 for Raspberry Pi which helps make the whole setup more plug-and-play. I use Django to configure the sensors. Along with the Django admin portal, I’m using a django_rq worker, a Redis worker, to listen for the jobs as they come in. I’m using a Django Redis scheduler which is running crons and scheduling known jobs at its cron intervals. Right now, it’s scheduled for every minute. Every 60 seconds is the lowest interval you can set with the RQ scheduler. The RQ scheduler is putting the job into Redis. Next, the RQ worker is actively listening to the Redis queue for the job. The RQ worker is communicating with a Postgres database to pull details needed about the job to allow it to execute and to collect the sensor data. I have sensors pulling data on: water temperature, water salinity, water level and pH levels. My ideal pH level is 8.3. There is a bit of range due to carbon dioxide levels in the air and C02 created by the fish. On any given day, my tank pH ranges between 7.95-8.19.

corals_02

Aquarium IoT monitoring solution architecture diagram

Once collected, the data is stored in InfluxDB. After collecting and storing the telemetry data a new event job is added to the Redis queue for an rq worker to evaluate and action on the telemetry data accordingly.

I also have purchased home automation tools from WeMo, which is owned by Belkin. They’re pretty cool because they can be controlled within your home network using multicasts. Adding the WeMo switches to the stack gave me the ability to turn devices on and off based on the telemetry data collected. An example is when a high temperature threshold is met. The rq_worker pulls the event from the Redis queue and based on the event definition it knows exactly which Wemo device to call based on its MAC address. The rq_worker then sends a multicast message to the switch to toggle the power on or off and reports back the results to the Redis job status. I also have another set of automation that is not directly integrated with the AquaPy, for instance I have an auto top off set up. It’s an optical sensor used to detect water level. If the water level drops too low, fresh water will automatically be added to the tank. Of course, adding too much fresh water the salinity would fall more than is acceptable. Simply adding an extra gallon of fresh water can stress the coral, and I could lose a colony. On the flip side, if there’s too much evaporation, the salinity level could become too high. If the water’s pH is skyrocketing, this could mean my doser is failing; the doser is responsible for adjusting the calcium and alkalinity. If the doser switch is stuck in the ON position, it will start dumping unnecessary chemicals into the tank. All of these factors can offset the balance of the tank.

Caitlin: After implementing InfluxDB, what did you learn about your aquariums?

Jeremy: Thanks to InfluxDB, I was able to set thresholds for temperature and other key metrics. If the water temperature rises above a certain level, I have a fan set up to automatically turn on. By automatically triggering the fan on, I’ve had less evaporation and the tanks have cooled down. As soon as the temperature has sufficiently dropped below the recovery threshold, the fan turns off automatically.

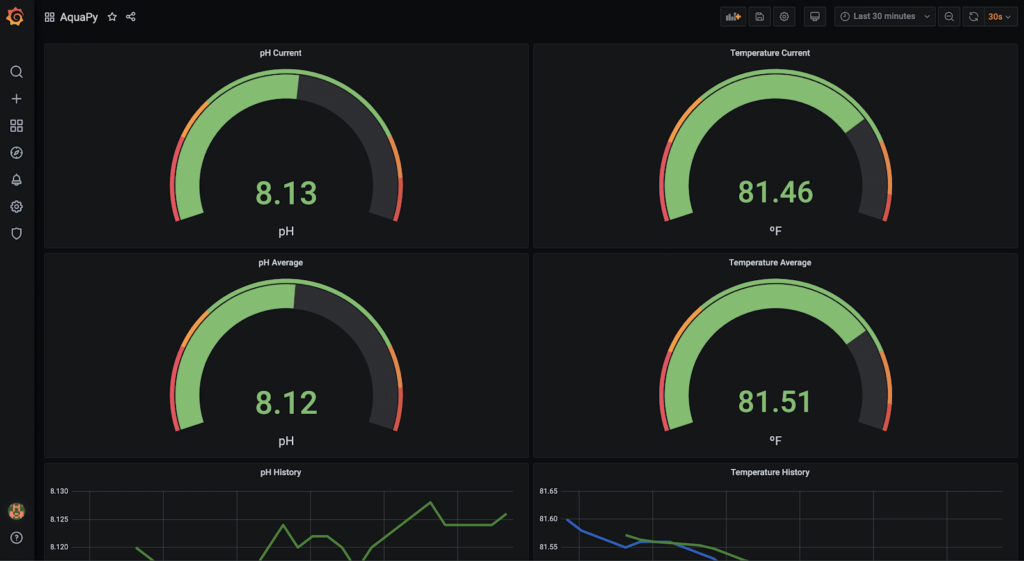
By monitoring my tank continuously, I know when something is amiss. A simple power outage can have a snowball effect on the health of my coral and tanks. Without power, the lights don’t work, which means the natural algae can’t convert the carbon dioxide back into oxygen. Even if the power is out for three hours, it could mean some of my coral could die. This is especially important if I’m introducing new pieces of coral to the tanks as they haven’t acclimatized to their new home. I now have a UPS as a battery backup. It does help being a network engineer! I now have enterprise-grade network equipment set up at home. Having spent a lot of time and money into my saltwater aquarium, I want to make sure I don’t lose anything. My internet connection, PoE network switch, router, firewall, etc. are all on separate UPSes. I recently moved, and while I don’t experience many power outages, there are still occasional brownouts. I’m using Grafana to visualize and graph all of my data. Originally, I was using one of Grafana’s plugins to send me Slack alerts. Thanks to Slackbots, if I get a notification on my phone, I know to check it for an update.

corals_03

Grafana dashboard displaying aquarium sensor data

Caitlin: What are your future plans with your aquariums and InfluxDB?

Jeremy: As I run my tanks with higher levels of calcium and alkalinity, I want to create some form of controlled studies around home aquariums. I’d like to be able to demonstrate the benefits of running tanks at specific levels. Faster calcification of hard corals hasn’t been proven with controlled studies. There’s a company called Bulk Reef Supply who’s also working on short lived experiments. They are running different systems at various levels with the same coral for a few weeks to months and reporting results. Once I get more data into InfluxDB, I’d like to start correlating my data. By having more time-stamped data, I’d like to set a baseline and determine a percentage deviation from baseline. I’d like to create these for all systems. As for right now, I’m not collecting metrics on threshold actions. These include when the fan turns on or off, time of day the dosing pump turns on, etc. My new aquarium lights are controlled via Bluetooth. In addition to adding all of this data into InfluxDB, I’d also like to incorporate the seasonal daylight times from Indonesia and northeast Australia better. As more of my coral is from there, I’d like to mimic the natural daylight cycle. Long-term goals including helping the scientific community by helping improve the natural coral reefs. By improving the world’s growing coral in captivity practices, hopefully we can stop needing to go back to the natural reefs for coral. It would be amazing if we could aquaculture enough coral to give back to the natural coral reefs that we’re destroying as a society.

Here is a list of all of the parts I’m using:

Do you have questions for Jeremy? Join InfluxDB on September 23, 2020 for our virtual Time Series Meetup as he demonstrates how to use InfluxDB and Grafana to monitor your aquarium!

RSVP today.


ntc img
ntc img

Contact Us to Learn More

Share details about yourself & someone from our team will reach out to you ASAP!

Monitoring Websites with Telegraf and Prometheus

Blog Detail

In network service delivery, the network exists to have applications ride on it. Yes, even voice is considered an application when it is riding over the top of the network. We have explored in previous posts how to get telemetry data from your network devices to get an understanding of how they are performing from a device perspective. Now, in this post, I will move on to exploring how to monitor web applications and DNS using Telegraf, Prometheus, and Grafana. Often your operations teams will receive reports of websites not working for a user or you are just looking to get some more visibility into your own web services. The following method could be used to get more insight into the network and the name resolution required for those applications.

There are also several other Telegraf inputs available including ping (ICMP) and TCP tests. As of this post in May 2020 there are 181 different input plugins available to choose from. Take a look at the Telegraf plugins for more details and explore what other plugins you may be able to use to monitor your environment.

I will not be going into the setup of these tools, as this is already covered in a previous post. The previous posts in the series are:

These posts can help you get up and running when it comes to monitoring your network devices in CLI, SNMP, and gNMI.

Blackbox exporter from Prometheus is also a valid choice for this process, and I encourage you to try both the Telegraf and Blackbox exporters in your environment.

Sequence Diagram

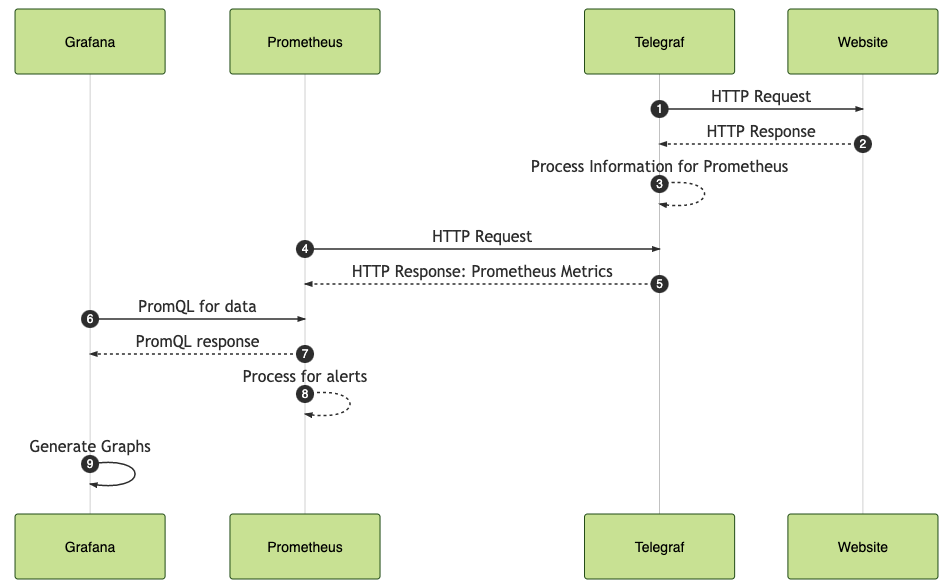
sequence

Telegraf Setup – HTTP Response

Telegraf has the HTTP Response plugin that does exactly what we would be looking to use for gathering metrics about a HTTP response. This lets you define the list of websites that you wish to monitor, set options for proxy, response timeout, method, any data you may want to include in the body, and various responses. Take a look at the plugin documentation for more details. Here is the configuration that is going to get setup for this demonstration:

#####################################################
#
# Check on status of URLs
#
#####################################################
[[inputs.http_response]]
  urls = ["https://www.networktocode.com", "https://blog.networktocode.com", "https://www.service-now.com"]
  method = "GET"
  follow_redirects = true

#####################################################
#
# Export Information to Prometheus
#
#####################################################
[[outputs.prometheus_client]]
  listen = ":9012"
  metric_version = 2

Upon executing this, here are the relevant Prometheus metrics that we are gathering:

# HELP http_response_content_length Telegraf collected metric
# TYPE http_response_content_length untyped
http_response_content_length{method="GET",result="success",result_type="success",server="https://blog.networktocode.com",status_code="200"} 1.791348e+06
http_response_content_length{method="GET",result="success",result_type="success",server="https://www.networktocode.com",status_code="200"} 123667
http_response_content_length{method="GET",result="success",result_type="success",server="https://www.service-now.com",status_code="200"} 478636
# HELP http_response_http_response_code Telegraf collected metric
# TYPE http_response_http_response_code untyped
http_response_http_response_code{method="GET",result="success",result_type="success",server="https://blog.networktocode.com",status_code="200"} 200
http_response_http_response_code{method="GET",result="success",result_type="success",server="https://www.networktocode.com",status_code="200"} 200
http_response_http_response_code{method="GET",result="success",result_type="success",server="https://www.service-now.com",status_code="200"} 200
# HELP http_response_response_time Telegraf collected metric
# TYPE http_response_response_time untyped
http_response_response_time{method="GET",result="success",result_type="success",server="https://blog.networktocode.com",status_code="200"} 0.371015121
http_response_response_time{method="GET",result="success",result_type="success",server="https://www.networktocode.com",status_code="200"} 0.186775794
http_response_response_time{method="GET",result="success",result_type="success",server="https://www.service-now.com",status_code="200"} 0.658694795
# HELP http_response_result_code Telegraf collected metric
# TYPE http_response_result_code untyped
http_response_result_code{method="GET",result="success",result_type="success",server="https://blog.networktocode.com",status_code="200"} 0
http_response_result_code{method="GET",result="success",result_type="success",server="https://www.networktocode.com",status_code="200"} 0
http_response_result_code{method="GET",result="success",result_type="success",server="https://www.service-now.com",status_code="200"} 0

You have several pieces that come back right away including:

  • content_length: How long the content is
  • response_code: HTTP response code
  • response_time: How long did it take for the request to process
  • result_code: This is a function of Telegraf, to take an OK response to map to 0

Telegraf – DNS Check

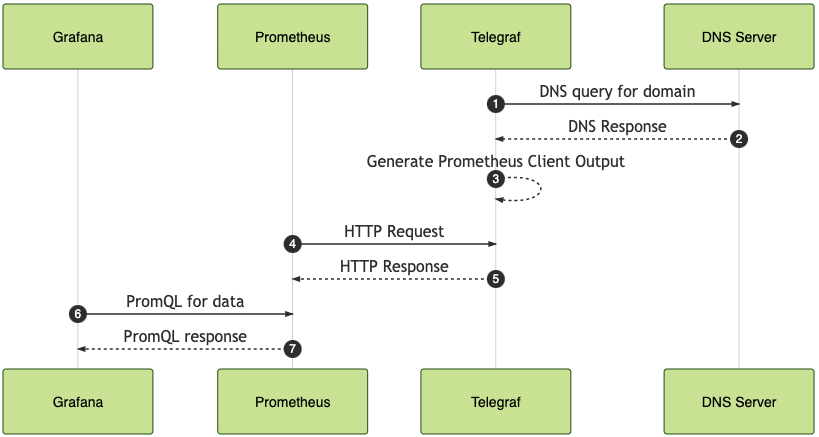
dns_sequence

On top of this, I want to also show how to add in a second input. We will add in a DNS query to test the name resolution of the sites as well to verify that the DNS lookup is working as expected. This could also be extended to test and verify DNS from a user perspective within your environment.

#####################################################
#
# Check on status of URLs
#
#####################################################
[[inputs.http_response]]
  urls = ["https://www.networktocode.com", "https://blog.networktocode.com", "https://www.service-now.com"]
  method = "GET"
  follow_redirects = true

[[inputs.dns_query]]
  servers = ["8.8.8.8"]
  domains = ["blog.networktocode.com", "www.networktocode.com", "www.servicenow.com"]

#####################################################
#
# Export Information to Prometheus
#
#####################################################
[[outputs.prometheus_client]]
  listen = ":9012"
  metric_version = 2

The new section is:

[[inputs.dns_query]]
  servers = ["8.8.8.8"]
  domains = ["blog.networktocode.com", "www.networktocode.com", "www.servicenow.com"]

Based on the plugin definition we are going to define to use the Google DNS resolver. And the interesting domains that we are going to verify are blog.networktocode.com, www.networktocode.com, and the popular ITSM tool ServiceNow.

Here is what gets added to the Prometheus Client output:

# HELP dns_query_query_time_ms Telegraf collected metric
# TYPE dns_query_query_time_ms untyped
dns_query_query_time_ms{domain="blog.networktocode.com",rcode="NOERROR",record_type="NS",result="success",server="8.8.8.8"} 70.950858
dns_query_query_time_ms{domain="www.networktocode.com",rcode="NOERROR",record_type="NS",result="success",server="8.8.8.8"} 48.118903
dns_query_query_time_ms{domain="www.servicenow.com",rcode="NOERROR",record_type="NS",result="success",server="8.8.8.8"} 48.552328
# HELP dns_query_rcode_value Telegraf collected metric
# TYPE dns_query_rcode_value untyped
dns_query_rcode_value{domain="blog.networktocode.com",rcode="NOERROR",record_type="NS",result="success",server="8.8.8.8"} 0
dns_query_rcode_value{domain="www.networktocode.com",rcode="NOERROR",record_type="NS",result="success",server="8.8.8.8"} 0
dns_query_rcode_value{domain="www.servicenow.com",rcode="NOERROR",record_type="NS",result="success",server="8.8.8.8"} 0
# HELP dns_query_result_code Telegraf collected metric
# TYPE dns_query_result_code untyped
dns_query_result_code{domain="blog.networktocode.com",rcode="NOERROR",record_type="NS",result="success",server="8.8.8.8"} 0
dns_query_result_code{domain="www.networktocode.com",rcode="NOERROR",record_type="NS",result="success",server="8.8.8.8"} 0
dns_query_result_code{domain="www.servicenow.com",rcode="NOERROR",record_type="NS",result="success",server="8.8.8.8"} 0

The corresponding values gathered from the dns_query input are:

  • dns_query_query_time_ms: Amount of time it took for the query to respond
  • dns_query_rcode_value: Return code value for a DNS entry
  • dns_query_result_code: Code defined by Telegraf for the response

Prometheus

The configuration for Prometheus at this point has a single addition to gather the statistics for each of the websites:

global:
  scrape_interval: 15s

scrape_configs:
  - job_name: 'prometheus'
    scrape_interval: 5s
    static_configs:
      - targets: ['localhost:9090']

  - job_name: 'telegraf website'
    scrape_interval: 10s
    static_configs:
      - targets:
        - "localhost:9012"

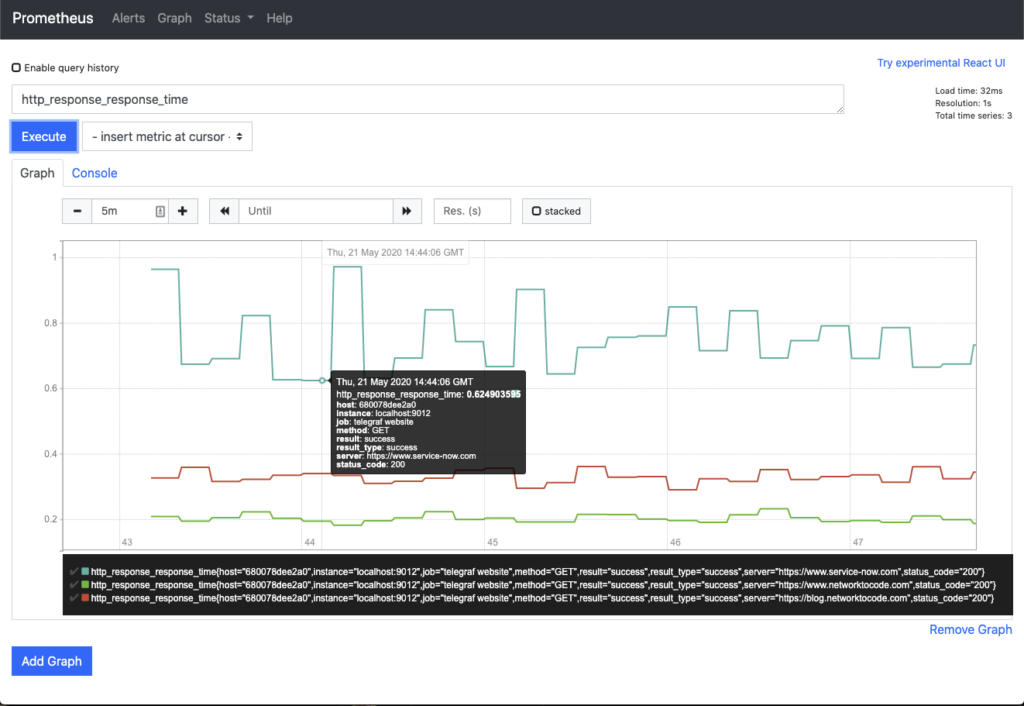
When you navigate to the base page to check on how Prometheus is doing with polling the data you can get a base graph. Here you see that all three sites are appearing on the graph with respect to response time:

prometheus

Grafana

What does it look like to get this information into a graph on Grafana?

Grafana – Websites

grafana_graph

To build this chart, this is a small configuration. In the Metrics section I only put the query of http_response_response_time. With the legend I set it to {{ server }} to get the website address as the table legend.

In the visualization section, the only thing that is needs to be doneis to adjust in the Left Y Axis Unit to be seconds (s) to provide the proper Y-Axis Metric.

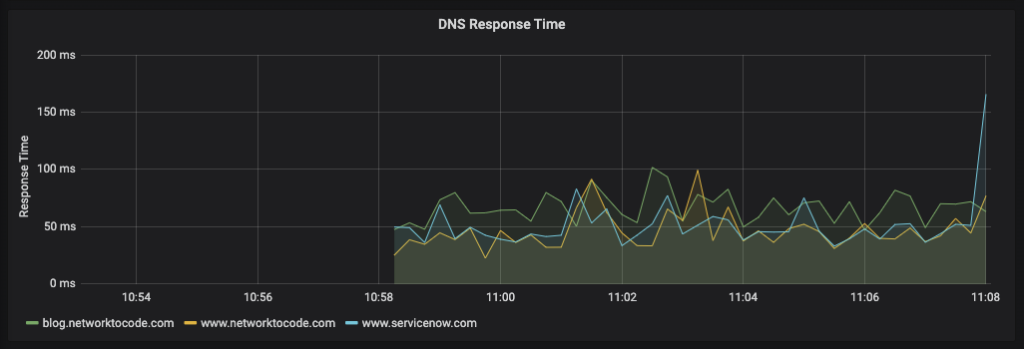
Grafana – DNS

dns_response_time

This is going to be another small configuration panel, similar to the previous one. In the Metrics section the corresponding query to get response time is dns_query_query_time_ms. The legend you then set to {{ domain }} to match that of what is in the query shown above.

In the visualization section, you should use the Unit of milliseconds (ms). If you copied the panel from the Website panel, don’t forget to change this. The unit of measure is in fact different and the time scale would be off.


Conclusion

Hopefully this post will help you gain some insight into your environment. We have been using this process internally at Network to Code already, keeping an eye on our key services that we rely on to understand if there is an individual issue or an issue with the service. Let us know your thoughts and comments! To continue the conversation, check out the #Telemetry channel inside the Network to Code Slack. Sign up at slack.networktocode.com.

-Josh


ntc img
ntc img

Contact Us to Learn More

Share details about yourself & someone from our team will reach out to you ASAP!