Network Automation Architecture – Part 04

Blog Detail

Over the last two years, in our Telemetry blog posts series we discussed many telemetry and observability concepts, showing characteristics of modern network telemetry. The telemetry stack and its architectural components: collectordatabase, visualization, and alerting make the network telemetry and observability the real evolution of the network monitoring. You probably also already heard from us about Telegraf, Prometheus, Data Enrichment, and Data Normalization. Each of these functions has been already introduced in our blog series.

Introduction to Architecture of the Network Telemetry and Observability

In this blog post, we will focus on the Architecture of Telemetry and Observability. Over the last years at Network to Code we developed the Network Automation Framework, which is also composed of the Telemetry & Observability element. The Network Telemetry and Observability stack is a critical piece of any network automation strategy and is a prerequisite to building advanced workflows and enabling event-based network automation. While I mentioned a few of the tools above, it is important to note that not every telemetry stack is the same, the elements are composable. Due to rapid development growth, many interesting and valuable tools have been made available in the last years.

While we introduced the architecture elements: collector, database, visualization, please refer for the details in Nikos’ blog post. In this particular blog, let’s discuss what we take into consideration while architecting a telemetry and observability solution.

The process of architecting a telemetry system starts with the analysis of requirements. Most common challenges with respect to the telemetry systems are as follows:

  • Heterogeneous data – data coming from different sources, in different formats (CLI, SNMP, gNMI, other)
  • Quality of the data within telemetry system (e.g., decommissioned devices, lack of normalization and enrichment)
  • Quality of the exposed data (i.e., lack of meaningful dashboards)
  • Lack of correlation between events
  • Number of tools involved (including legacy, not deprecated)
  • System configuration overhead (i.e., missing devices)

As you might notice, most of our challenges are due to data quality or complexity, not necessarily due to tools or software used. Those challenges are often the triggers for the telemetry system overhaul or even a complete replacement.

Architecting the Telemetry System

Telemetry Stack Components

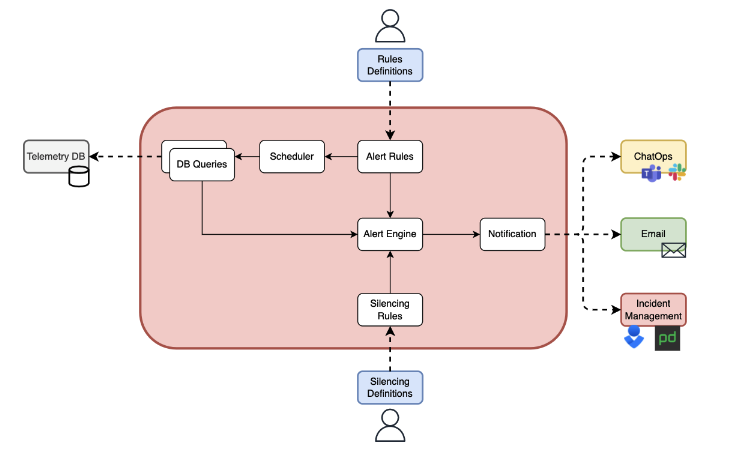
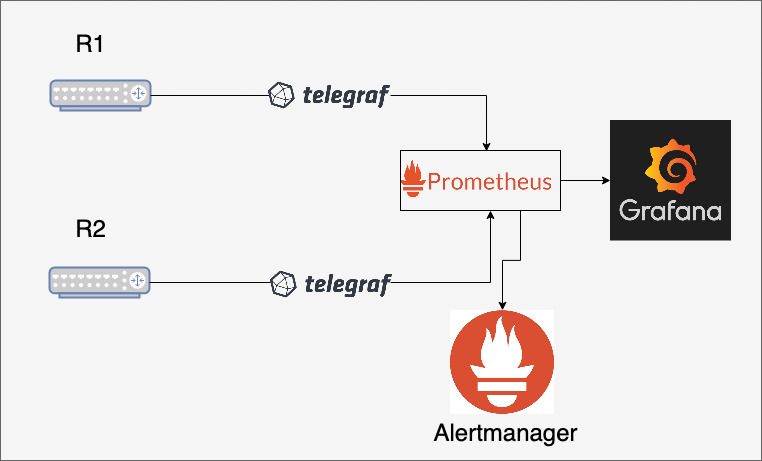
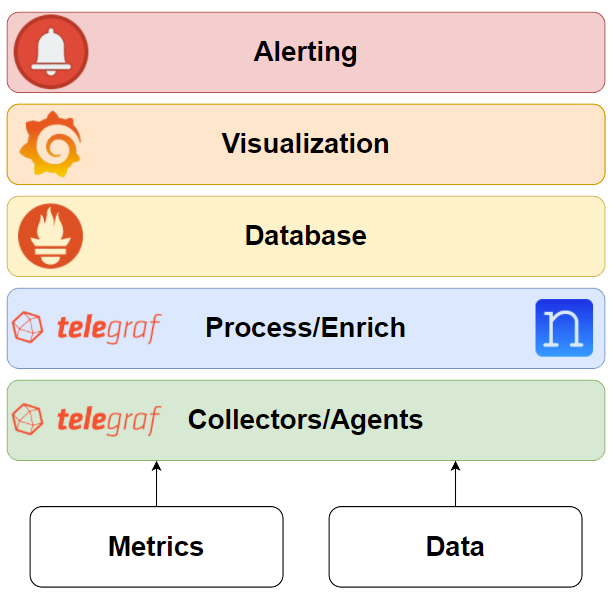
During the architecture process, we follow the stack architecture presented below. We consider the stack as composed of the following elements: collector, database, visualization, and alerting. For the detailed information about each of those, please refer to our previous blog posts.

Understanding Requirements

To start the architecture process, we have to define and understand constraints, dependencies, and requirements. Not every system is the same, each one has unique needs and serves a unique purpose.

Dividing requirements with regard to the specific components allows viewing the system as a set of functions, each serving a different purpose. Below, I present just a set of example requirements; while the list is not full, it might give you ideas about how many architectures we could design with different components fitting the use cases. Telemetry stacks are customizable, each of the functions can be implemented in a number of ways, including the integrations between components.

General Requirements – Examples

  • What is the data to be collected? (Logs? Flows? Metrics?)
  • What is the extensibility of the designed system?
  • What is the scalability of the designed system? Is horizontal scalability needed?
  • What is the expected access? (API? UI? CLI?)
  • Who will use the system, and how will they use it? (Capacity Planning Team? NOC? Ad hoc users?)
  • How will the system’s configuration be generated? (Collectors?)
  • How will the system’s load be distributed? (Regional pods?)
  • How does the organization deploy new applications?
  • How are users trained to use new applications?

Collector

  • What is the expected data resolution?
  • What is the expected data collection method? (gNMI? SNMP?)
  • What is the expected data? (BGP? System metrics?)
  • What is the deployment model? (Container on the network device? Stand-alone?)
  • Are the synthetic metrics needed?

Data Distribution and Processing

  • Which data will be enriched and normalized?
  • What are the needed methods to perform data manipulations? (Regex? Enum?)
  • How will the data flow between systems? (Kafka?)
  • How will the data be validated?

Database

  • What is the preferred query language? (Influx? PromQL?)
  • What are the backfilling requirements?
  • What are the storage requirements? (Retention period?)
  • What is the preferred database type? (Relational? TSDB?)

Visualization

  • Can we correlate events displayed?
  • Can we create meaningful, role-based, useful dashboards?
  • Can we automatically generate dashboards? (IaaC?)
  • Can we use source-of-truth data (e.g., site names) in the dashboards?
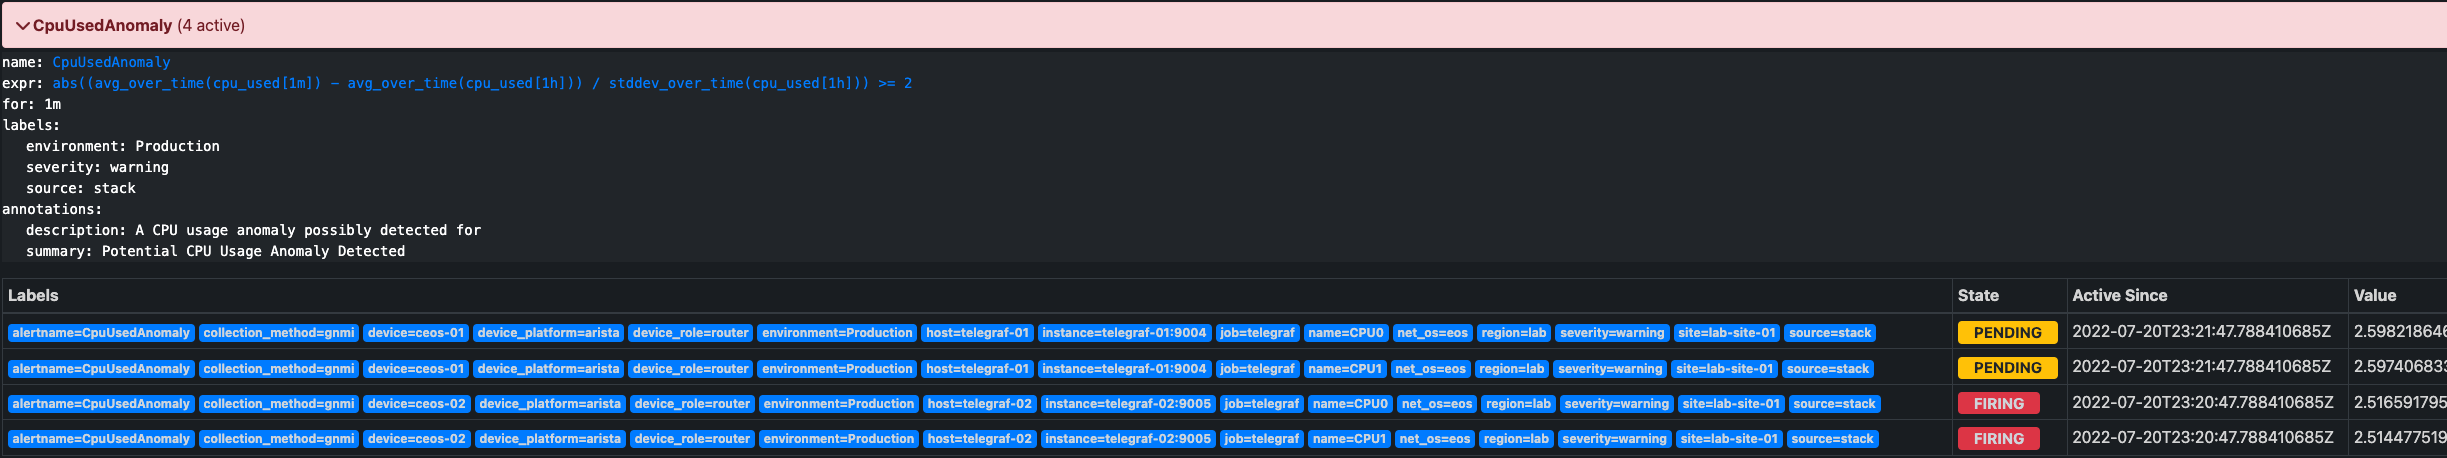
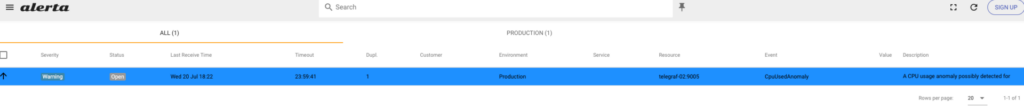
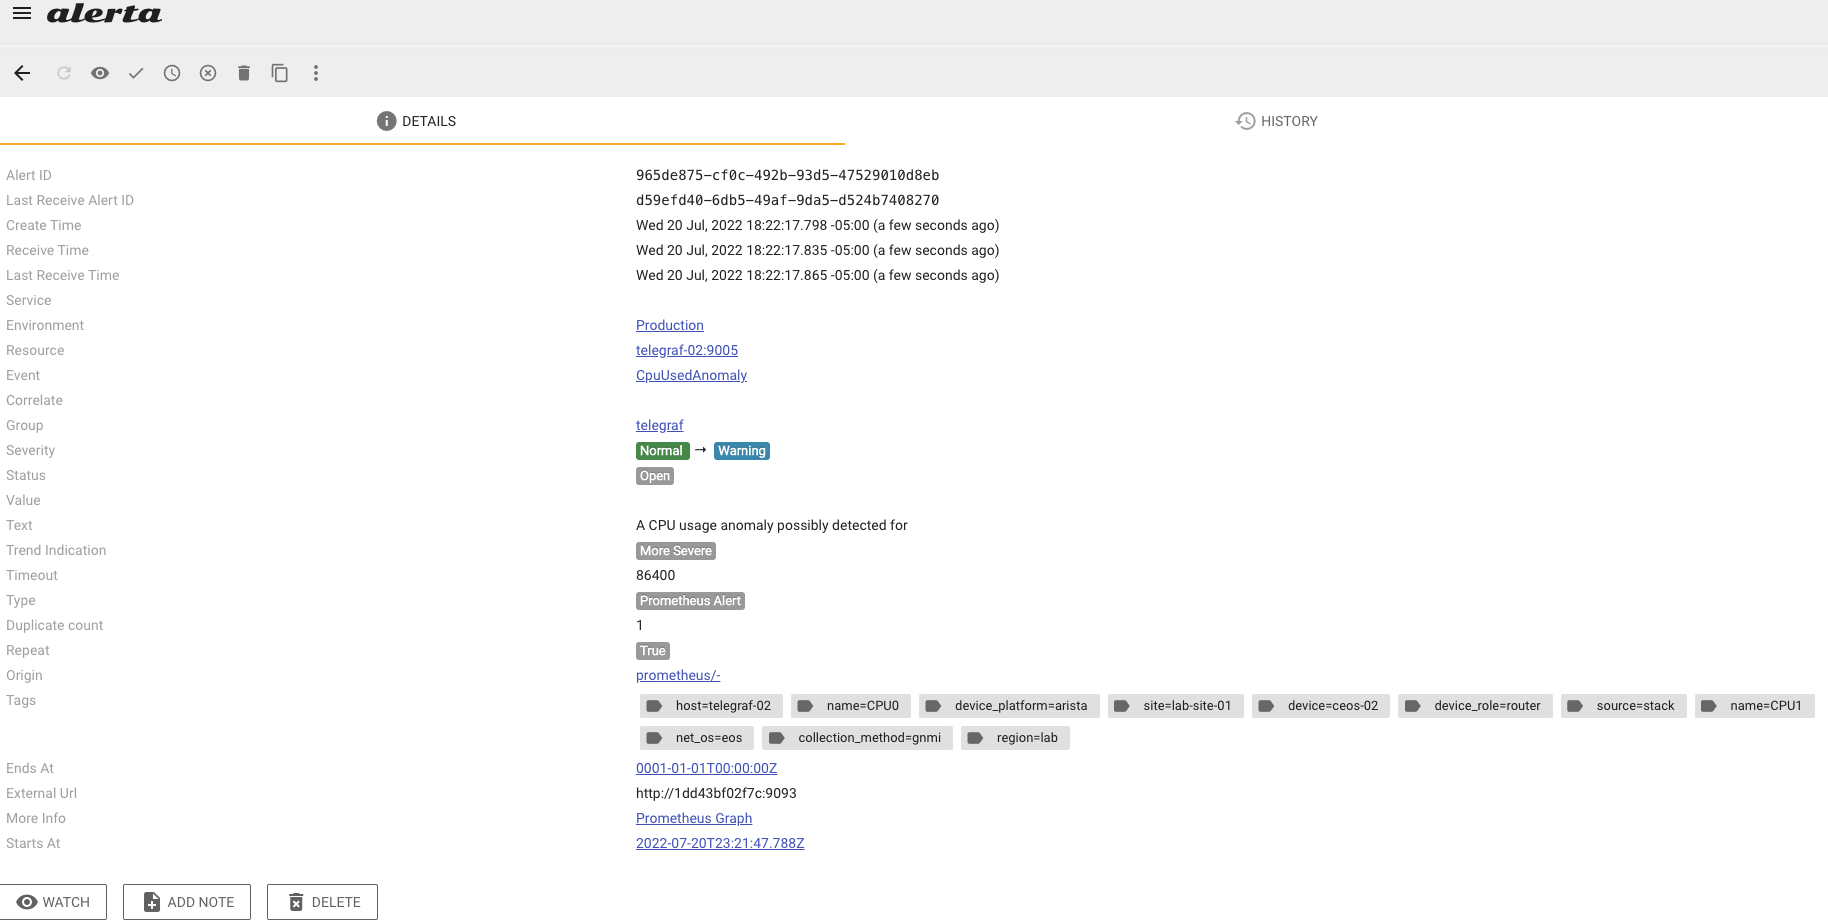
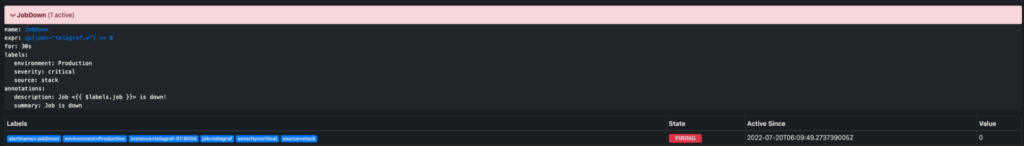
Alerting

  • What are the available integrations? (Automation Orchestrator? Email? Slack?)
  • How will the alerts be managed?
  • Can we use source-of-truth data (e.g., interface descriptions, SLAs) with the alerts?

Designing the System

The process of designing a telemetry system is preceded by understanding and collecting specific requirements, preparing the proof of concept (“PoC”) plan, and delivering the PoC itself. The PoC phase allows for verifying the requirements, testing the integrations, and visually presenting the planned solution. PoC is aligned with the design documentation, where we document all the necessary details of the architected telemetry and observability system. We find answers for and justify all the requirements: constraints, needs, and dependencies.

Implementing the System

Implementing a telemetry system requires us to collaborate with various teams. As we introduce the new application, imagine we have to communicate with:

  • Network Engineering (system users)
  • Security (access requirements)
  • Platform (system deployment and operations)
  • Monitoring (system users)

Telemetry and observability systems are critical to every company. We must ensure the implemented system meets all the organization’s requirements. Not only do we have to map existing functionalities into the new system (e.g., existing Alerts), we have to ensure all the integrations work as expected.

Telemetry and observability implementation involves the application deployment and configuration management. To achieve the best user experience through an integration, we can leverage the Source of Truth systems while managing the configurations. This means a modern telemetry and observability solution has the Source of Truth at its center. The configuration files are generated in a programmable way, utilizing data fetched from the SoT system to ensure that only information within the scope of the SoT is used to enrich or normalize the telemetry and observability system.

Using the System

While the system is implemented, we work on ensuring the system is being used properly. There are several use cases for the telemetry and observability, thus some of the usage examples involve:

  • Collecting from a new data source or new data (metric)
  • Scaling the collector system for a new planned capacity
  • Presenting new data on a dashboard or building a new dashboard
  • Adding a new alert or modifying an existing one
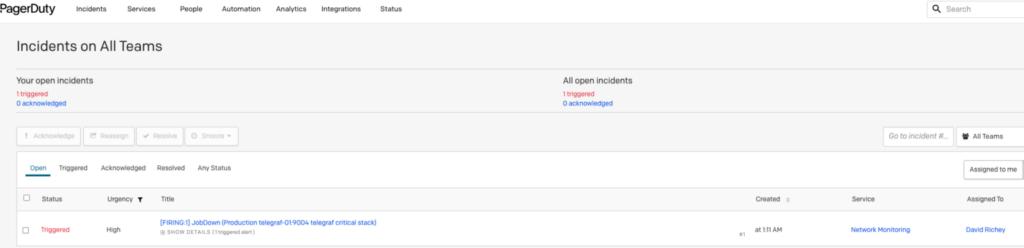
  • Receiving and handling (silencing, aggregating) an alert

Conclusion

As we recognize the potential challenges of any new system being introduced, we ensure the system’s functions are well known for system users. This is critical for telemetry and observability systems, as those typically introduce a set of protocols, standards, and solutions that might be new in a certain environment.

-Marek


ntc img
ntc img

Contact Us to Learn More

Share details about yourself & someone from our team will reach out to you ASAP!

Introduction to a Telemetry Stack – Part 4

Blog Detail

Welcome back for Part 4 of the Telemetry Stack! series. The action is steadily ramping up and sticking with The Fast and the Furious analogy. We actually have two guest stars (read: services) featured in this blog. However, I don’t want to spoil the surprise, so you’ll just have to read on!

In this post we will focus on advanced alerting techniques, such as the deadman and standard deviation. Then we will see how we can utilize a few Prometheus / Alertmanager integrations for alert and incident management.

Prerequisites

As this blog is part of a series, it builds on what we have explored in the previous posts. Knowledge of the telemetry stack TPG (Telegraf, Prometheus, Grafana) and the basics of metrics gathering and alerting is advised. These topics can all be explored or refreshed at the following links:

Advanced Alerting Overview

As perfectly stated in Xenia’s previous post, an alert is “an alarm or other signal of danger” and must be a “meaningful signal of urgency and not constant white noise that is often ignored”. There are many philosophies to alerting, but we tend to take a page from the Google SRE Book, specifically Ch. 6 – Monitoring Distributed Systems, as a guiding principle.

The power of metrics, and subsequently alerts generated from those metrics, can often encourage an “alert on all the things” behavior. And while it looks great on a coverage spreadsheet, I have found that ultimately it leads to alert oversaturation and on-call exhaustion. As an observability team, we must find a way to design meaningful alert and response contracts with our stakeholders. And as painful as it might sound, not every alert is critical. An overuse of critical or emergency will only serve to create the Cry-Wolf Phenomenon. In other words, assign severity with an overabundance of caution.

We will be exploring just a few concepts here that can turbocharge your alerting, keep your team sane, and perhaps work towards that ever lofty goal of simplicity over complexity.

Deadman Switch

Ahh, the infamous deadman switch. A powerful technique with a grotesque name that you might have interacted with at some point in your daily life! If you have ever operated a lawn mower, ridden a jet ski, or taken the subway, you have interacted with a deadman switch. It’s essentially a safety feature to disable the machine if the human operator becomes disabled for whatever reason.

The deadman switch is typically used in monitoring systems to indicate that something went wrong in your observability pipeline. It could be Telegraf failing to gather, Prometheus failing to store, or Alertmanager going offline. It can be a form of self-monitoring or watching the watcher.

The concept is actually quite simple: send an alert when a metric we expect to be there isnt! To be clear, we are not interested in the value of the metric but rather whether it ceases to exist.

Let’s look at some examples.

Here I will stop my Telegraf monitoring container, thus eliminating the gathering of interface metrics for device ceos-01. We will take advantage of the Absent() function, which returns an empty vector if the metric exists or a 1-element vector with the value of 1 if it does not exist. The screenshot shows the times and graph of our now missing metrics.

Deadman Graph

This could indicate that the device stopped responding to polling for numerous reasons, or if corresponded with an up{job="telegraf"} != 1, we could see whether the actual Telegraf poller stopped, which is exactly what happened.

Here is what an example alerting rule in Prometheus might look like utilizing Absent().

  - name: Missing Device Metrics
    rules:
      - alert: MissingDeviceMetrics
        expr: absent(interface_admin_status)
        for: 2m
        labels:
          severity: high
          source: telegraf
          environment: Production
        annotations:
          summary: "Device metrics not being collected"
          description: "Metrics for {{ $labels.device }} are missing. Check device or collector"

Now that you have seen an example of a deadman alert, can you think of other ways you would use this in a metrics pipeline? Remember, alert when something is missing!

Recording Rules

“Recording rules allow you to precompute frequently needed or computationally expensive expressions and save their result as a new set of time series. Querying the precomputed result will then often be much faster than executing the original expression every time it is needed.” – Prometheus Docs

A great example of recording rules would be pre-calculating the rates of interface traffic over a period of time and then storing that as a separate metric for quick querying for alerting or graphing. In this example, I will set up a recording rule to gather the inbound interface traffic, but from six hours ago! This will allow us to graph historical on top of current, which could be done easily enough in this example with a query. However, think of the recording rule where you could compare traffic week by week or over the last month! This opens the doors for seasonality in your alerts.

Here is our recording rule. We take the rate of interface_in_octets, offset by 6H, and multiply by 8 to change our unit back to bps.

---
groups:
  - name: recording
    rules:
      - record: interface:interface_in_octets:rate6h
        expr: rate(interface_in_octets[5m] offset 6h) *8

It is difficult to see, but the dotted blue line is the mgmt0 traffic from six hours ago. 

Recording Rule Historical Traffic

Standard Deviation and Anomaly Detection

Let’s pretend that we have been tasked with creating a rule to alert on network device CPU usage for multiple device vendors in our environment. One manufacturer might set the “normal” CPU load at anything less than 80%, while another might consider anything higher than 60% to be a problem. How can we solve this without creating tens if not hundreds of threshold rules and variations of these rules? Answer: Standard deviation.

“In statistics, the standard deviation is a measure of the amount of variation or dispersion of a set of values.[1] A low standard deviation indicates that the values tend to be close to the mean (also called the expected value) of the set, while a high standard deviation indicates that the values are spread out over a wider range.” – Wikipedia

Standard deviation is a fantastic method to implement to find potentially anomalous behavior and further free ourselves from rule and alert overload. Instead of very tedious and specific threshold alerts, we can rely on basic statistics that are more generic, thus encompassing potentially more uses.

Another thing to note here is that threshold alerting is a fantastic (sarcasm) way to create false positives that will ultimately have your team ignoring these alerts and suffering mightily during an on-call rotation. In other words, use them with caution!

What does this mean? If we record (remember those recording rules?) the long running average of what we are interested in, we can determine whether the current (now) values are outside of the average (mean) by a number of deviations, which is called the z-score.

Here is an example of Percentage CPU used on a device (green line) and the plot of the standard deviation for a small average window (blue line). In this example, it is quite easy to see the CPU usage anomalies when the blue line exceeds ~3 on the right axis.

 Stddev Graph

For z-score parameters, “Based on the statistical principles of normal distributions, we can assume that any value that falls outside of the range of roughly +3 to -3 is an anomaly.” – GitLab Anomaly Detection Using Prometheus

Therefore, we can create rules to record and alert when we have a z-score outside of +3/-3.

  - record: cpu:cpu_used:avg1d
    expr: avg_over_time(cpu_used[1d])

  - record: cpu_stddev:cpu_used:stddev1d
    expr: stddev_over_time(cpu_used[1d])
  - name: CPU Used Anomaly
    rules:
      - alert: CpuUsedAnomaly
        expr: abs((avg_over_time(cpu_used[5m]) - cpu:cpu_used:avg1d) / cpu_stddev:cpu_used:stddev1d) >= 3
        for: 1m
        labels:
          severity: medium
          source: telegraf
          environment: Production
        annotations:
          summary: "Potential CPU Usage Anomaly Detected"
          description: "A CPU usage anomaly possibly detected for {{ $labels.device }} on {{ $labels.name }}"

Prometheus and Alertmanager Integrations

Prometheus and its alerting component Alertmanager benefit from a great number of popular integrations that can be leveraged by organizations. What exactly are integrations? Let’s use the example of the popular organization messaging application, Slack. Alertmanager has an integration to send messages to a Slack workspace and channel with a highly customizable message format.

Here is a short list of Alertmanager integrations:

  • email
  • opsgenie
  • pagerduty
  • slack
  • VictorOps
  • webhook

Prometheus itself has a great number of alert integrations available via its webhook receiver that can be explored here.

Another way that integrations can work with Alertmanager is if they are designed to utilize the Alertmanager API. One very useful tool for visualizing alerts comes to mind here: Karma. Karma is designed to visualize alerts using a very modern and unique method of grouping. You can take some action against the alerts, but it is probably best used as a visualization dashboard.

This brings us to Alerta. Let’s dive into Alerta, shall we?

Alerta

Alerta Dashboard 

Alerta is a fully integrated alerting dashboard that allows NOC/SRE/NRE users to perform actions against alerts, create notes, create blackout windows, and generate reports. It supports a multitude of authentication and authorization mechanisms, alert grouping and correlation, and a rich API.

Configuring Alerta is as simple as defining it with a webhook_receiver in Alertmanager. For example:

  receivers:
  - name: alerta
    webhook_configs:
    - send_resolved: true
      url: http://alerta-01:8080/api/webhooks/prometheus

So, let’s see it in action with our own alerts!

Here, I cause a CPU usage anomaly with a slightly lower threshold for the purpose of actually generating an alert easily. First, the alert is detected and sent to Alertmanager by Prometheus. 

Prometheus CPU Anomaly

Then, Alerta routes the alert to Alerta based on the labels in the alert. Here, we see the alert list, and you can see the CPU Anomaly Alert.

Clicking the alert will display it in detail along with all of the label sets and any other associated data. 

Alerta CPU Alert List Detail

PagerDuty

PagerDuty is an industry-leading incident management system with over 650 integrations! It handles incidents, runbook automation, on-call, and bizops, all from a single SaaS platform.

In this section, I will demonstrate just how easy it is to integrate it with their EventsV2 endpoint that is fully supported by Alertmanager. We will configure our example to only send to PagerDuty for events labeled with critical. It is crucial to think of your on-call staff, SLAs, and alert exhaustion (not to mention on-call PTSD). I always try to approach severity classification with the following mantra: “Is this serious enough to wake someone up at 3am to respond?” Again, I fall back to the Google SRE Book, specifically Ch4. Service Level Objectives.

Alertmanager Config

<span role="button" tabindex="0" data-code="— global: resolve_timeout: 30m route: # Let's set a default route, as required receiver: alerta routes: – group_by: – alertname match: source: stack receiver: alerta – group_by: – alertname match: source: stack severity: critical receiver: pagerduty receivers: – name: pagerduty pagerduty_configs: – routing_key:
---
global:
resolve_timeout: 30m
route:
# Let's set a default route, as required
  receiver: alerta 
    routes:
    - group_by:
      - alertname
      match:
        source: stack
      receiver: alerta
    - group_by:
      - alertname
      match:
        source: stack
        severity: critical
      receiver: pagerduty
  
receivers:
- name: pagerduty
  pagerduty_configs:
  - routing_key: <your_pager_duty_eventsv2_routing_key>

- name: alerta
  webhook_configs:
  - url: http://alerta-01:8080/api/webhooks/prometheus
  send_resolved: true
job-down
pagerduty-incident-1536x372

Conclusion

Phew! Now that was a lot to cover in just one blog! As we could easily go down the rabbit hole on each of these topics, I will be providing a list of links for follow-up reading, especially around the anomaly detection, as it is an entire blog unto itself.

Together, we explored some advanced alerting concepts, such as the Deadman, where we learned that we could alert on missing metrics. Then came Recording Rules and their power to store pre-computed metrics that would otherwise become computationally expensive to query. These same recording rules then enabled us to move on to our next topic, standard deviation. That demonstrated how to get out of the threshold alert rule game and started exploring Standard Deviation based alerts that have the power to alert us to anomalous behavior.

Finally, our guest stars of the hour: We took a look at two of our favorite Prometheus alerting integrations (with an honorable mention of Karma) here at NTC, Alerta and PagerDuty. We saw how to leverage the power of Alerta for alert management with RBAC and hand-off and how to page our on-call staff when things are really critical.

I hope you enjoyed this blog post. Stay tuned for the next installment in our telemetry series! Rumor has it, a wild antlered animal is the main star!

-David Richey

Links for further reading:


ntc img
ntc img

Contact Us to Learn More

Share details about yourself & someone from our team will reach out to you ASAP!

Introduction to a Telemetry Stack – Part 3

Blog Detail

This is the third part of the telemetry stack introduction. In the first part, we discussed the stack big picture and how we collect data using Telegraf and network plugins such as SNMP and gNMI. In the second part, we addressed data normalization and enrichment. In this third part, we will get into alerting and observing the network.

Alerting is an art and a science. It is a science because it can be deterministic, based on profiling data, and subjected to strong statistical analysis. It is an art because it needs to be based on strong context, subject matter expertise, and sometimes, intuition. Alerting is encountered in almost any area in computing, such as information security, performance engineering, and of course, networking. There is a multiplicity of tools for generating alerts based on AI, machine learning, and other hot technologies. But, what makes a good alert? The answer is: triggering on symptoms not causes, simplicity, visualization that can point to root cause, and actionability.

In this blog, we analyze the alerting systems’ architecture, focus on how to generate meaningful alerts with Alertmanager, and how to create clean visualizations that help us point out alerts before they even get triggered. We start with basic definitions and move to the details of implementing alerts using the Telegraf, Prometheus, Grafana, Alertmanager (TPGA) stack.

Prerequisites

This blog is part of a series. You can read this independently of the series if you are familiar with the Telemetry stack TPG (Telegraf, Prometheus, Grafana) and the basics of collecting telemetry with modern techniques, such as streaming. However, you can start your journey from the beginning with Introduction to a Telemetry Stack – Part 1 and then Introduction to a Telemetry Stack – Part 2, which covers normalization and enrichment.

What Is an Alert?

An alert according to Merriam-Webster dictionary is: “an alarm or other signal of danger” or “an urgent notice.” That is exactly why an alert for a computing system has to be a meaningful signal of urgency and not constant white noise that is often ignored.

In computing, alerts are used to offer awareness of issues in a timely manner. Alerts may notify about the interruption of a service, an intrusion, or a violated baseline performance threshold. They are usually part of a monitoring system and can be paired with an automated action to reduce or eliminate the event that caused the alert.

Types of Alerts

There are two types of alerts:

  • Scheduled: Scheduled alerts occur at specific time periods. An example may be an alert for weekly maintenance of system patching.
  • Real-time: Real-time alerts are triggered by events. Events occur randomly, and therefore continuous monitoring is required to capture these.

Alert Triggers

The triggering events that generate alerts can be grouped in the following categories:

  • Status: This is a binary on/off trigger that indicates the status of a system. Context matters in the case of binary triggers regarding whether one should page a human or automation because of these alerts.
  • Threshold: These are continuous metrics that are based on the profile of normal operation. They are instantaneous violations of a continuous spectrum of values, e.g., CPU passed the threshold of 80%. Again, context matters here. Is this normal for the device or exceptional? Profiling helps define what normal operation is.
  • Aggregation: This trigger is similar to threshold, however in this case values are aggregated over a sliding time window. This can be a double-edged sword. On one hand, these triggers may offer a more complete picture in aggregating metrics for an alert. On the other hand, sliding windows have overlap, and this may cause unnecessary alerts.

How Does an Alerting System Work?

The figure below depicts how an alerting system works. The alert engine is the heart of the system and it takes three inputs: user-defined alert rules, database data related to events that can trigger the alerts, and silencing rules that are used to avoid unnecessary alerts. The output of the alert engine is a notification that is sent to outside systems, such as ChatOps, email, or incident management tools.

Alerting System Work

Metrics for a good alert?

Objective metrics are used to measure if an alert that adds value and is in turn actionable. These metrics are: the sensitivity and specificity. We define the sensitivity as “How many relevant events are reported by our alerts?” and measure it using the following formula: True_Positives / (True_Positives + False_Positives). Intuitively, if the sensitivity is high, our alert is pretty good, right? The more real alerts compared to “crying wolf” alerts, the better off we are with our pagees getting alerted and actually waking up to take care of business. We define specificity as True_Negatives / (True_Negatives + False_Negatives). Intuitively, this means that our alerts are detecting actual value and ignore the non-value adding events. In the figure below, the first half of the square calculates sensitivity and the second part specificity.

Metrics for a good alert

Implementing alerts with Alertmanager

In this section, we will review the TPGA stack used for alerting, then analyze the Alertmanager architecture, and finally we will demonstrate with examples how it can be used for alerting.

TPGA observability stack

We use the TPGA stack as seen in the figure below. We deploy two instances of Telegraf agent to collect the relevant data to our stack. This choice is common in network topologies, dedicating a lightweight agent for each device that is being monitored. In our case, each agent is monitoring an Arista cEOS router. The Telegraf gNMI plugin is used to gather interface operating status information and the execd plugin is used to capture BGP status. If you are not familiar with these plugin configurations, you can read the first part of the telemetry series. Prometheus is the Time Series Database (TSDB) of choice for its synergy with Alertmanager. Finally, Grafana is the visualization tool that we have selected since it specializes in time series depiction.

observability

What is Alertmanager?

Alertmanager is a meta-monitoring tool that uses the Prometheus TSDB events to generate alerts. Note that the Alertmanager is a separate instance from Prometheus with a good reason. First, scalability of multiple Prometheus instances and one Alertmanager instance can achieve centralization of events and avoid excessive notifications, i.e., noise. Second, decoupling of the Alertmanager maintains modularity in the design and functionality.

The Alertmanager has three main functions:

  • Grouping: Grouping is one of its most attractive features, since it contributes to reducing noise by combining multiple alarms and bundling them to one.
  • Inhibition: This is another function that aims at reducing noise by stopping sending error alarms once an initial alarm is issued.
  • Silences: Finally, silences stop sending repeated alarms within a time window.

Alertmanager has two main parts in its architecture: the router and the receiver. An alert passes through a routing tree, i.e., set of hierarchically organized rules, and then it is distributed to the corresponding receiver.

How to Configure Alertmanager and Prometheus?

First, we need to edit the configuration.yml file that has the basic configuration of Prometheus and add the following:

---
# other config

rule_files:
  - rules/*.yml

alerting:
  alertmanagers:
    - static_configs:
      - targets:
        - alertmanager-01:9093

The rule files are a key to alerting, since this is where we place the alert rules in YAML syntax. In addition, the Alertmanager is defined by its name, in our case alertmanager-01, and the port 9093 where it listens. We can have a list of Alertmanager instances and rule locations.

Then the Alertmanager’s routes and receivers need to be configured in the alertmanager.yml configuration file:

---
global:
  resolve_timeout: 30m

route:
  receiver: empty_webhook
  routes:
  - group_by:
    - alertname
    match:
      source: testing
    receiver: empty_webhook


receivers:
- name: empty_webhook
  webhook_configs:
  - send_resolved: true
    url: http://localhost:9999

Note that we have added an empty route because, for now, our alert is not going to notify another system, such as a chat client or incident response. In the last part of the telemetry series, you will see how to configure the receivers and generate notifications.

Alert Use Case 1: Interface Down

First we will show the Grafana visualization tools that we can use to alert an operator that the interface is down. I have chosen two specific types of graphs in this case. The first is a table that indicates the status of interfaces, the second is a state timeline of the status of all interfaces that belong to a device. These graphs in themselves are a good way of alerting an operator. However, we want notifications and eventually actions, that is why we need the Alertmanager.

Interface Down

To configure the Alertmanager, we add the following rule in rules/device_rules.yml and based on the above configuration of Prometheus, this rule is included into its Alertmanager instance:

<span role="button" tabindex="0" data-code="groups: – name: Interface Down rules: – alert: InterfaceDown expr: interface_oper_status{} == 2 for: 1m labels: severity: critical source: stack environment: Production annotations: summary: "Interface is down" description: "Interface for host
groups:
  - name: Interface Down
    rules:
      - alert: InterfaceDown
        expr: interface_oper_status{} == 2
        for: 1m
        labels:
          severity: critical
          source: stack
          environment: Production
        annotations:
          summary: "Interface is down"
          description: "Interface for host <{{ $labels.instance }}> is down!"

This alert will fire after querying the Prometheus metric interface_oper_status and finding out that the state is down or equal to 2. Note that this rule will trigger every minute based on the keyword for. We can specify different labels for additional meta information and add a meaningful message in the description. Below you can see a short demo of how the alert fires.

Interface Down

Alert Use Case 2: BGP Neighbor Unreachable

Again, a picture is worth a thousand words. In our case, the Grafana graphs offer color coded information of what is in the BGP state. The state information can be found in the list below:

IDLE = 1
CONNECT = 2
ACTIVE = 3
OPENSENT = 4
OPENCONFIRM = 5
ESTABLISHED = 6
BGP Neighbor Unreachable

The configuration for this alert can also be placed in: rules/device_rules.yml.

<span role="button" tabindex="0" data-code="groups: – name: BGP Neighbor Down rules: – alert: BGPNeighborDown expr: bgp_session_state{device="ceos-01"} == 1 for: 1m labels: severity: warning source: stack environment: Production annotations: summary: "BGP Neighbor is down" description: "BGP Neighbor for host
groups:
  - name: BGP Neighbor Down
    rules:
      - alert: BGPNeighborDown
        expr: bgp_session_state{device="ceos-01"} == 1
        for: 1m
        labels:
          severity: warning
          source: stack
          environment: Production
        annotations:
          summary: "BGP Neighbor is down"
          description: "BGP Neighbor for host <{{ $labels.instance }}> is down!"

The difference of this alert is in the severity message, and as you can see, we are only interested in the ceos-01 device neighbors based on the Prometheus query. For more information about PromQL queries and syntax, you can reference one of my older blogs, Introduction to PromQL.

BGP Neighbor Unreachable

Recap & Announcement

We have reviewed the basics of alerting systems and how to configure Prometheus and Alertmanager. If you enjoyed this series of blogs for Telemetry, this is not the end! There is one more upcoming blog about advanced alerting techniques.


Conclusion

We have some exciting news for you as well. If you want to learn how to setup your own telemetry stacks and scale it in production grade environments by NTC automation experts, check the NEW course on telemetry deep dive by NTC training.

-Xenia

Resources


ntc img
ntc img

Contact Us to Learn More

Share details about yourself & someone from our team will reach out to you ASAP!